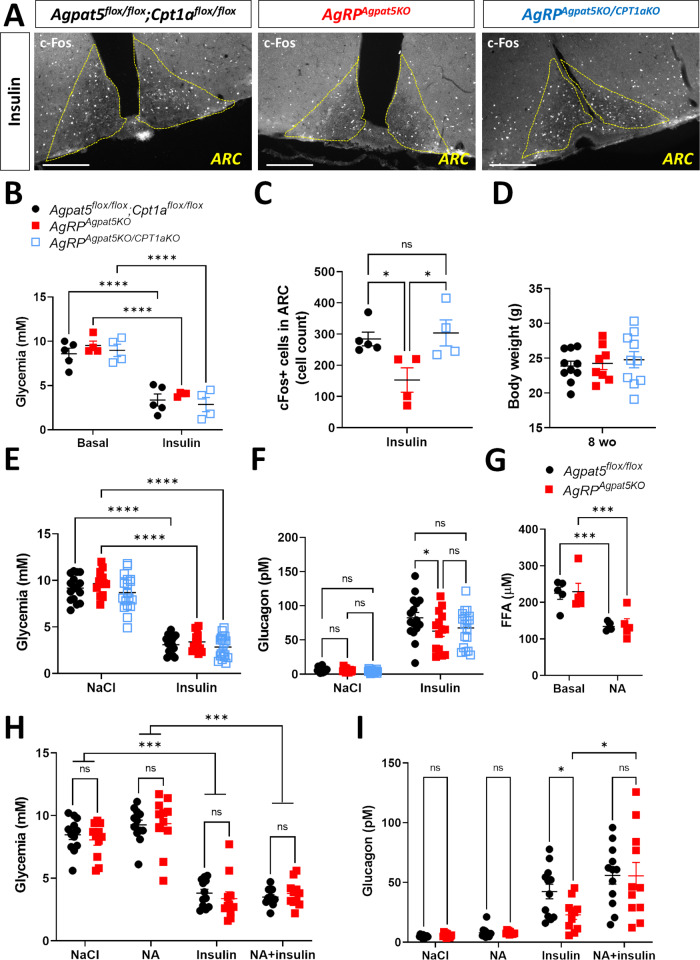
Fig. 6. Inactivation of Cpt1a or reducing circulating free fatty acids in AgRPAgpat5KO mice restores hypoglycemia-activated AgRP neurons and glucagon secretion.
Agpat5flox/flox;Cpt1aflox/flox mice, AgRPAgpat5KO mice and AgRPAgpat5KO/Cpt1aKO mice were injected with insulin and c-Fos expression in the ARC nucleus was quantitated 1 h later. A c-Fos staining in the ARC of the three mouse lines. Scale bar, 200 μm. B Glycemic levels. C Quantification of c-Fos staining in the ARC of the three mouse lines, n = 4–5 mice, three different bregmas/animal. Mice from the three genotypes were injected with NaCl or insulin and plasma glucagon levels were measured one hour later. D Body weight. E Glycemia 1 h after i.p. NaCl or insulin injection. F Plasma glucagon levels. B–F Data are mean ± SEM, two independent cohorts, n = 10–15 mice. *p < 0.05, **p < 0.01 and ***p < 0.001, one-way (C) or two-way ANOVA with Tukey’s multiple comparisons correction (B, D–F). 5 h-fasted Agpat5flox/flox mice and AgRPAgpat5KO mice received an i.p. injection of NaCl or nicotinic acid (NA) to reduce plasma free fatty acids levels. 30 min later they received an i.p. insulin injection and plasma glucagon was measured one hour later. G Plasma free fatty acid levels before and 30 min after i.p. NA injection, n = 5 mice. H Glycemia 30 min after NaCl or NA injection and 1 h following insulin injection in NaCl or NA injected mice. I Plasma glucagon levels in the conditions described in (H). NA-induced decrease in free fatty acids restored glucagon levels in AgRPAgpat5KO mice to those of Agpat5flox/flox mice, two independent cohorts, n = 10–11 mice. G–I Data are mean ± SEM. *p < 0.05, **p < 0.01 and ***p < 0.001, two-way ANOVA with Tukey’s multiple comparisons correction.

