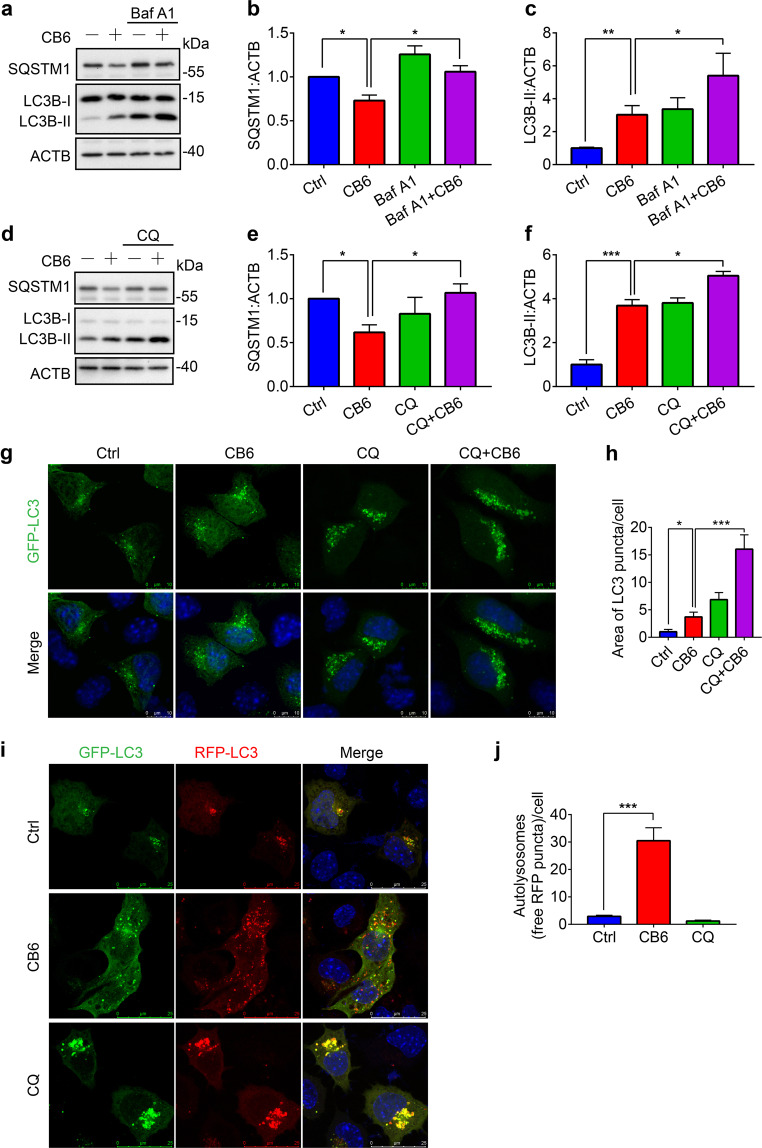
Fig. 2. CB6 induces autophagy flux in neural cells.
a Representative Western blots show the levels of SQSTM1 and LC3B in N2a cells. N2a cells were treated with CB6 (20 µM) for 12 h. Three hours before harvesting cells, the v-ATPase inhibitor bafilomycin A1 (Baf A1, 100 nM) was added to the cell culture medium to inhibit the autophagosome-lysosome fusion. b, c The relative levels of SQSTM1 and LC3B-II in a were quantified as mean ± SEM from three independent experiments. *P < 0.05 and **P < 0.01 vs. CB6 group. d Representative Western blots show the levels of SQSTM1 and LC3B in N2a cells. N2a cells were treated with CB6 (20 µM) for 12 h. Three hours before harvesting cells, the lysosomal inhibitor chloroquine (CQ, 100 µM) was added into cells to block the lysosomal degradation. e, f The relative levels of SQSTM1 and LC3B-II in d were quantified as mean ± SEM from three independent experiments. *P < 0.05 and ***P < 0.001 vs. CB6 group. g Representative immunostaining images show the pattern of GFP-LC3 in N2a cells. N2a cells were transfected with GFP-LC3 plasmids for 24 h and then treated with CB6 (20 µM) for 12 h with or without CQ (100 µM) (CQ was added into cells 3 h before fixing cells). Scale bar: 10 µm. h Statistical results for the area of green puncta in each cell in g. At least 25 cells were analyzed in each group. *P < 0.05 and ***P < 0.001 vs. CB6 group. i Representative immunostaining images show the pattern of tf-LC3 in N2a cells. N2a cells were transfected with tf-LC3 plasmids for 24 h and then treated with CB6 (20 µM) for 12 h using CQ (100 µM) as a negative control. Scale bar: 25 µm. j Statistical results for the mean number of autolysosomes (puncta with red color in merged images) in each cell in (i). Data were quantified as mean ± SEM. ***P < 0.001 vs. Ctrl group.

