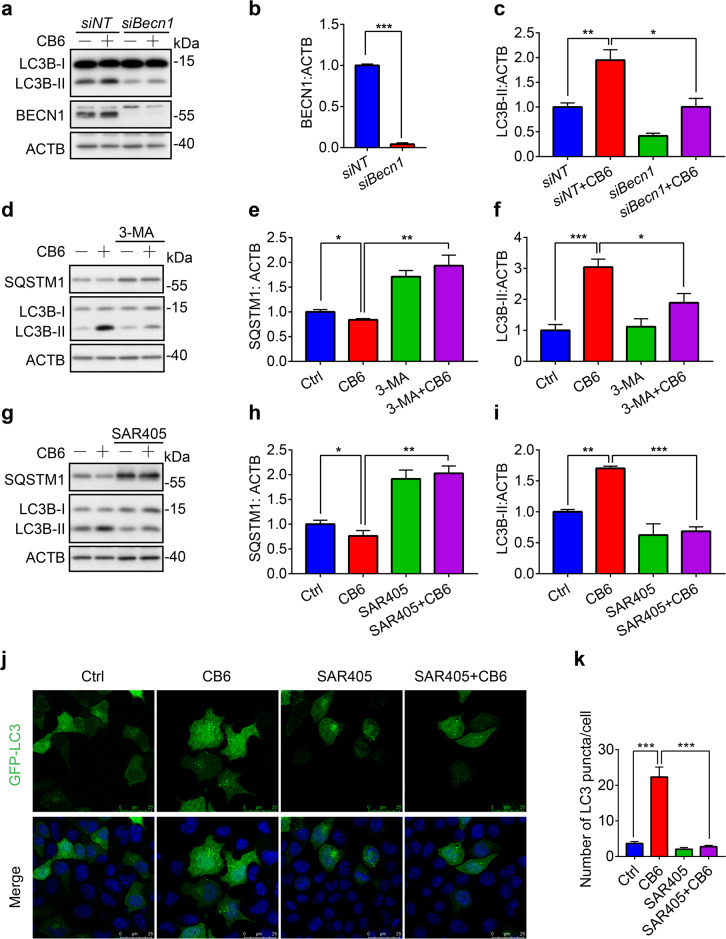
Fig. 4. PIK3C3 complex is involved in CB6-induced autophagy.
a After transfection with nontarget or Becn1 specific siRNAs for 60 h, N2a cells were treated with CB6 (20 µM) for another 12 h. b The relative levels of BECN1 in (a) were quantified as mean ± SEM from three independent experiments. ***P < 0.001 vs. siNT group. c The relative levels of LC3B-II in (a) were quantified as mean ± SEM from three independent experiments. *P < 0.05 and **P < 0.01 vs. siNT + CB6 group. d After pretreatment with PIK3C3 inhibitor 3-methyladenine (3-MA, 5 mM) for 30 min, N2a cells were treated with CB6 (20 µM) for another 12 h. e, f The relative levels of SQSTM1 and LC3B-II in d were quantified as mean ± SEM from three independent experiments. *P < 0.05, **P < 0.01 and ***P < 0.001 vs. CB6 group. g After pretreatment with PIK3C3 inhibitor SAR405 (5 µM) for 30 min, N2a cells were treated with CB6 (20 µM) for 12 h. h, i The relative levels of SQSTM1 and LC3B-II in g were quantified as mean ± SEM from three independent experiments. *P < 0.05, **P < 0.01 and ***P < 0.001 vs. CB6 group. (j) Representative immunostaining images show the pattern of GFP-LC3 in N2a cells. After transfection with GFP-LC3 plasmids for 24 h, N2a cells were treated with CB6 (20 µM) for 12 h in the presence or absence of SAR405 (5 µM) (SAR405 was added into cells 30 min before CB6 treatment). Scale bar: 25 µm. k Statistical results for the mean number of green puncta in each cell in j. At least 20 cells were analyzed in each group. ***P < 0.001 vs. CB6 group.

