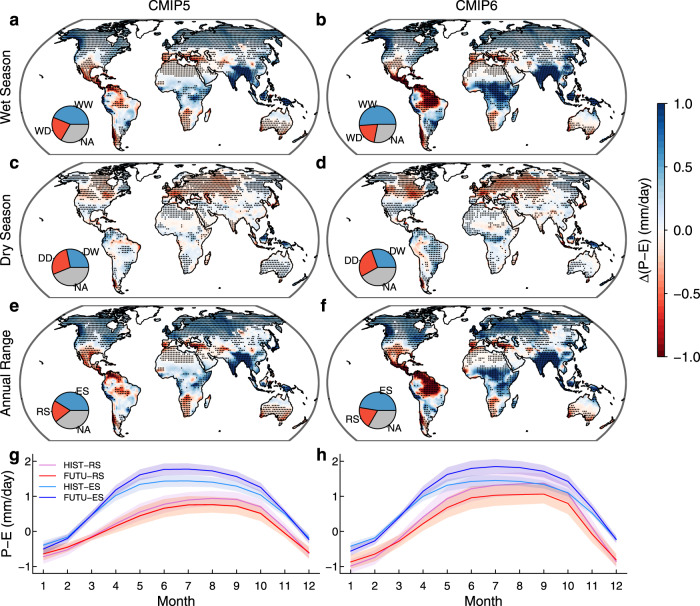
Fig. 1. Multi–model mean seasonal changes in water availability in CMIP5 and CMIP6.
a–d Changes in water availability (Δ(P–E)) in the wet season (a, b) and dry season (c, d) between historical (1971–2000) and future (2071–2100, RCP8.5 or SSP585) periods (future minus historical). e, f The same as (a–d) but for changes in the annual range of P–E between wet and dry seasons. The dry/wet season is defined as three consecutive months with lowest/highest mean P–E in the historical period in each model. Stippling denotes regions where the sign of Δ(P–E) is significantly robust (p value < 0.05), i.e., the sign is consistent with the sign of multi–model means (as shown in the figure) for more than 65% of the 35 CMIP5 models and of the 30 CMIP6 models (see Methods). The pie chart insets show proportions of land area with (stippling) and without robust P–E changes. Antarctica and Greenland are excluded. DD (DW) represents dry season showing robust P–E decreases (increases), while WW (WD) represents wet season showing robust P–E increases (decreases). RS (ES) represents reduced (enhanced) seasonality of P–E, assessed as robust decreases (increases) in the annual range of P–E. “NA” represents insignificant changes in P–E (p value > 0.05). g, h Mean seasonal cycle of P–E for RS and ES regions in the historical (HIST) and future (FUTU) periods. The sequence of months is organized to start from the first month of dry season. The shading in g, h shows the standard deviation of P–E across the assessed models.

