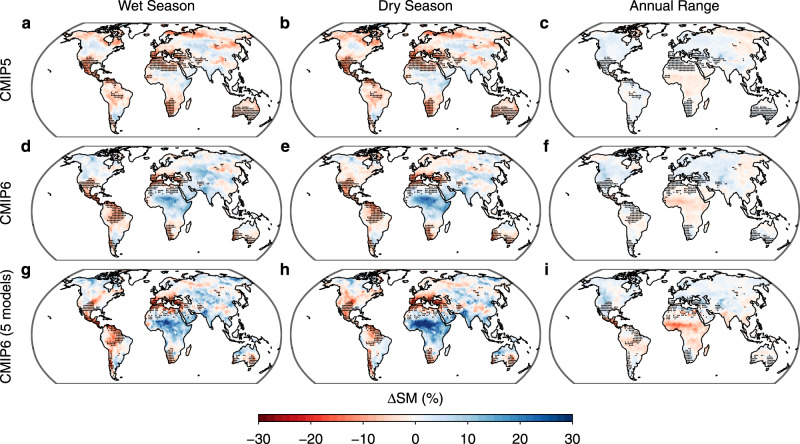
Fig. 2. Multi-model mean seasonal changes in soil moisture in CMIP5 and CMIP6.
The percent change in soil moisture (ΔSM) is assessed between 1971–2000 (historical simulation) and 2071–2100 (RCP8.5 or SSP585 simulation) in 35 CMIP5 models (a–c) and 30 CMIP6 models (d–f), and between 1980–2000 (historical simulation) and 2080–2100 (SSP585 simulation) in the five CMIP6 models which also participated in the LFMIP-pdLC experiment (g–i). Stippling denotes reduced seasonality regions in Fig. 1e (35 CMIP5 models, first row), Fig. 1f (30 CMIP6 models, second row), and Fig. 3c (5 CMIP6 models, third row).

