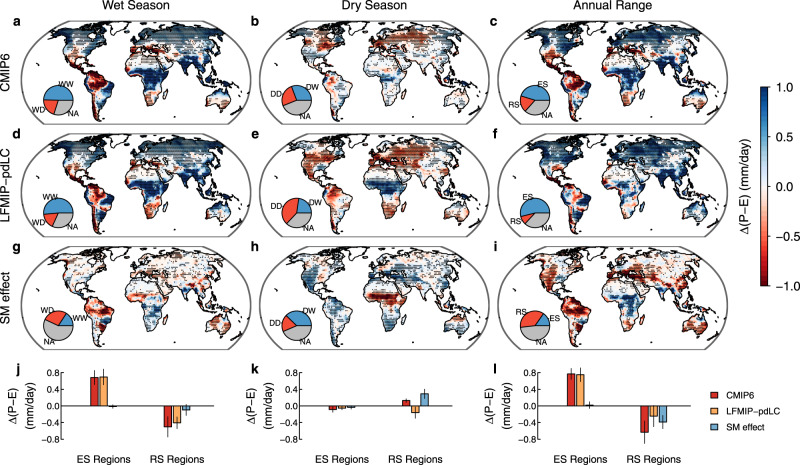
Fig. 3. Soil moisture effects on water availability in the wet and dry seasons in CMIP6.
a–c Multi-model mean seasonal changes in water availability (Δ(P-E)) between 1980–2000 (historical simulation) and 2080–2100 (SSP585 simulation) in the five CMIP6 models which participate in the LFMIP-pdLC experiment. d–f The same as (a–c) but for Δ(P-E) in LFMIP-pdLC (without soil moisture effect). g–i Soil moisture (SM) effects on Δ(P-E) assessed as CMIP6 minus LFMIP-pdLC results. Stippling denotes regions where the sign of Δ(P-E) is consistent with the sign of multi-model means (as shown in the figure) for at least four of the five models. The pie chart insets show proportions of land area with (stippling) and without robust P-E changes, similar to those in Fig. 1. j–l Total area-weighted Δ(P-E) in enhanced seasonality (ES) regions and reduced seasonality (RS) regions in CMIP6 (c). The error bars show the standard deviation of Δ(P-E) across the five models.

