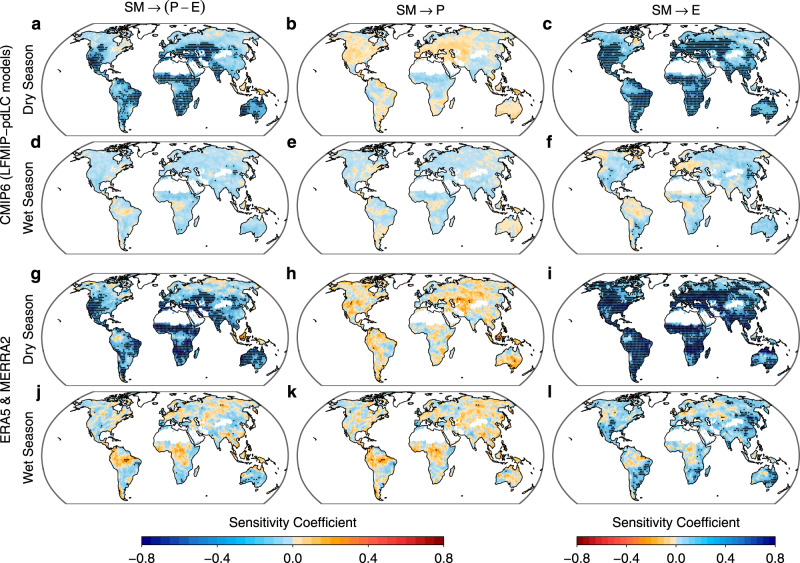
Fig. 4. Soil moisture feedbacks on water availability in the wet and dry seasons.
a–f Mean sensitivity coefficients for soil moisture (SM)→precipitation minus evapotranspiration (P-E), SM→P, and SM→E identified based on historical and SSP585 simulations (1980–2100) of the five CMIP6 models which participate in the LFMIP-pdLC experiment. g–l The same as (a–f), but for mean sensitivity coefficients from reanalysis products ERA5 (1979–2019) and MERRA-2 (1980–2019) (d–f). The sensitivity coefficient for X→Y denotes the partial derivative of Y in the wet/dry seasons to X in the prior month. In each model/reanalysis product, the seasonal cycles and long-term trends in X and Y are removed and the remaining variations of X and Y are standardized in the wet and dry seasons individually. Stippling denotes regions where the sensitivity coefficient is significant at the 95% level according to a bootstrap test and the sign of the sensitivity coefficient is consistent with the sign of multi-model means (as shown in the figure) in all models/reanalysis products.

