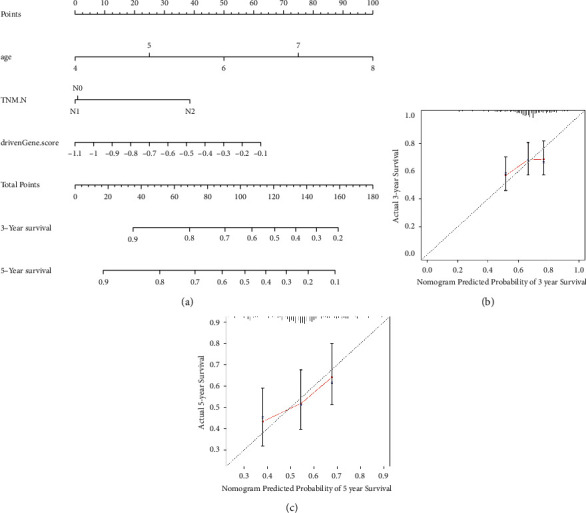
Figure 3.

Nomogram generation and validation. (a) The constructed nomogram for evaluating the 3- and 5-year OS of patients with lung squamous cell carcinoma. Calibration curve of (b) 3- and (c) 5-year OS for the nomogram. The black dotted line represents the ideal predictive model, whilst the red solid line represents the observed model. OS, overall survival (days).
