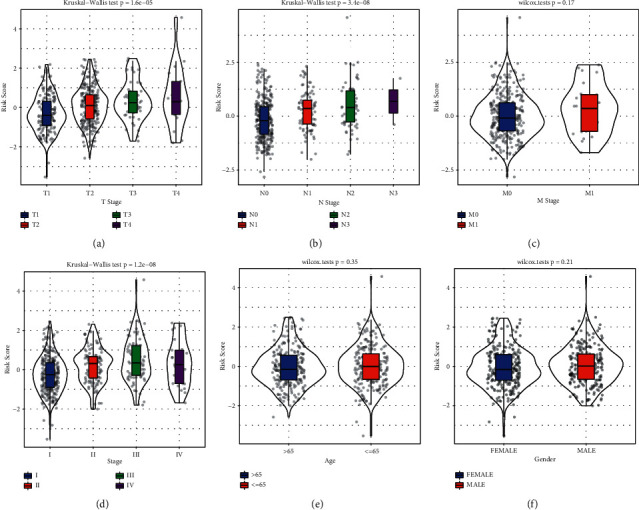
Figure 10.

The distribution of risk score in different clinical features including T stage (a), N stage (b), M stage (c), stage (d), ages (e), and genders (f). Kruskal‒Wallis test was conducted among four groups and Wilcoxon test was conducted between two groups.
