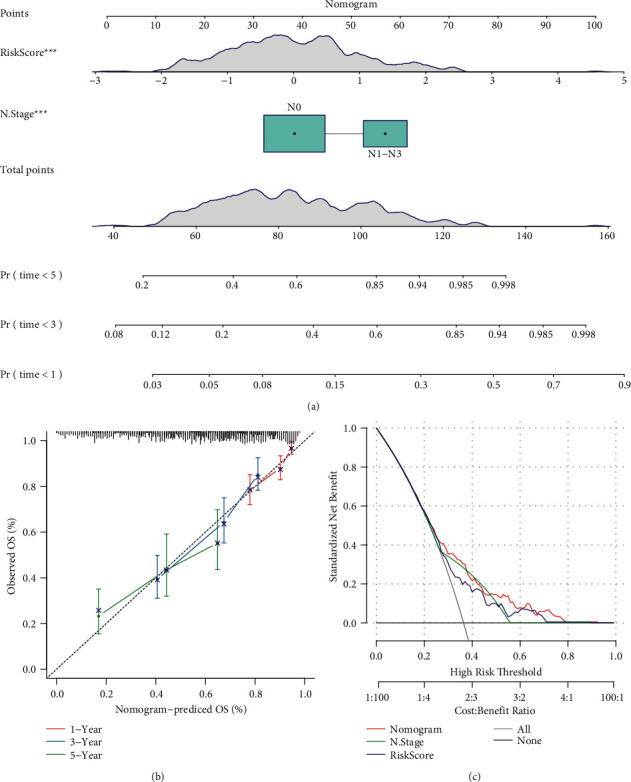
Figure 13.

Establishing a nomogram based on risk score. (a) A nomogram based on risk score and N stage for predicting 1-year, 3-year, and 5-year death rate. (b) Calibration curve of 1-year, 3-year, and 5-year overall survival predicted by the nomogram. (c) DCA curve of the nomogram, N stage and risk score. OS, overall survival.
