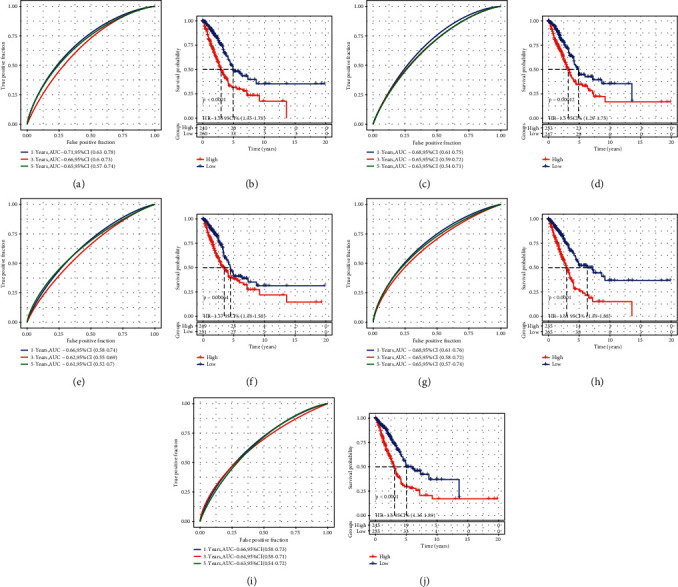
Figure 14.

Comparison with other gene signatures of LUAD obtained from other studies including Li et al. (a‒b), Xue et al. (c‒d), Liu et al. (e‒f), Sun et al. (g‒h), and Al-Dherasi et al. (i‒j). A, C, E, G, and J represent ROC curves and B, D, F, H, and J represents Kaplan‒Meier survival plots. Log-rank test was conducted.
