
Figure 4.
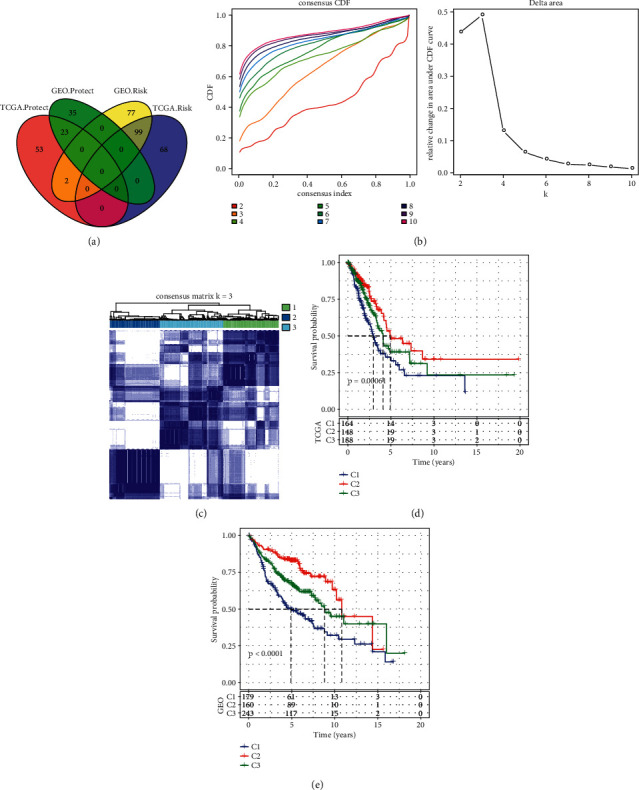
Construction of molecular subtypes based on epi-PCGs. (a) Venn plot for identifying the intersected epi-PCGs associated with prognosis between TCGA-LUAD and GEO datasets. Protect means the positive correlation between the expression of epi-PCGs and survival, and risk means the converse one. (b) CDF curve of cluster number k = 2 to 10 in unsupervised consensus clustering. (c) Consensus matrix when k = 3. (d‒e) Kaplan‒Meier survival analysis of three molecular subtypes in TCGA-LUAD (d) and GEO (e) datasets. Log-rank test was conducted.