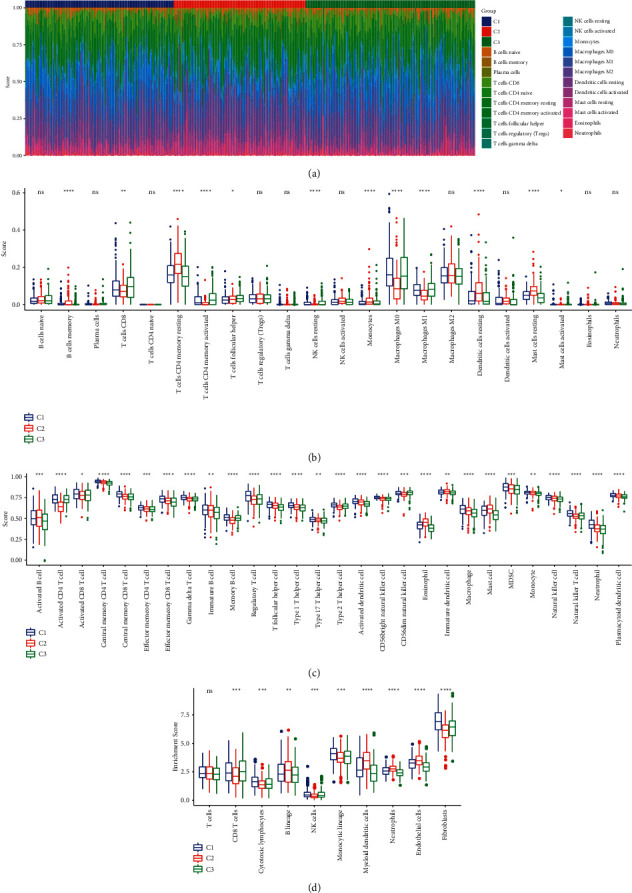
Figure 5.

The distribution of immune-related cells in TME. (a) A heatmap presenting the distribution of 22 immune cells in three subtypes. (b) Enrichment score of 22 immune cells in three subtypes assessed by CIBERSORT. (c) Enrichment score of 28 immune cells in three subtypes assessed by ssGSEA. (d) Enrichment score of 10 immune cells analyzed by MCP-counter analysis. ANOVA test was conducted.NS, no significance. ∗P < 0.05, ∗∗P < 0.01, ∗∗∗P < 0.001, and ∗∗∗∗P < 0.0001.
