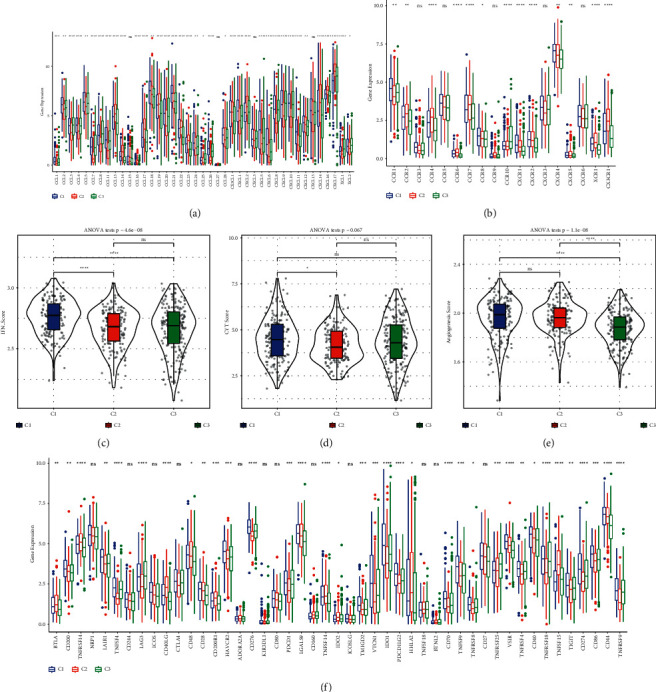
Figure 6.

Characterizing the different TME among three subtypes. (a‒b) Gene expression of chemokines and chemokine receptors in three subtypes. (c‒e) Enrichment score of IFN-γ, CYT and angiogenesis in three subtypes. (f) The expression of 47 immune checkpoints in three subtypes. ANOVA test was conducted. NS, no significance. ∗P < 0.05, ∗∗P < 0.01, ∗∗∗P < 0.001, and ∗∗∗∗P < 0.0001.
