Figure 7.

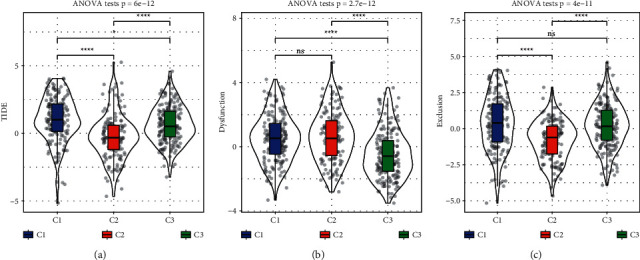
TIDE analysis for predicting the response to immunotherapy indicated by TIDE score (a), T cell dysfunction (b), and T cell exclusion (c). ANOVA test was conducted. NS, no significance. ∗P < 0.05 and ∗∗∗∗P < 0.0001.

TIDE analysis for predicting the response to immunotherapy indicated by TIDE score (a), T cell dysfunction (b), and T cell exclusion (c). ANOVA test was conducted. NS, no significance. ∗P < 0.05 and ∗∗∗∗P < 0.0001.