
Figure 7.
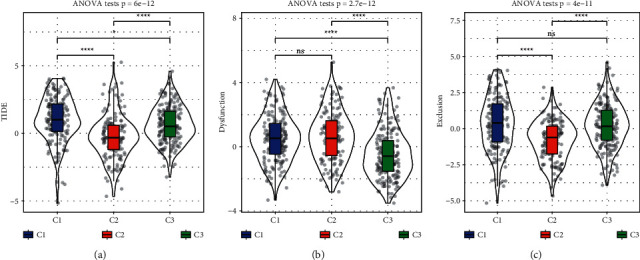
TIDE analysis for predicting the response to immunotherapy indicated by TIDE score (a), T cell dysfunction (b), and T cell exclusion (c). ANOVA test was conducted. NS, no significance. ∗P < 0.05 and ∗∗∗∗P < 0.0001.
Official websites use .gov
A
.gov website belongs to an official
government organization in the United States.
Secure .gov websites use HTTPS
A lock (
) or https:// means you've safely
connected to the .gov website. Share sensitive
information only on official, secure websites.
TIDE analysis for predicting the response to immunotherapy indicated by TIDE score (a), T cell dysfunction (b), and T cell exclusion (c). ANOVA test was conducted. NS, no significance. ∗P < 0.05 and ∗∗∗∗P < 0.0001.