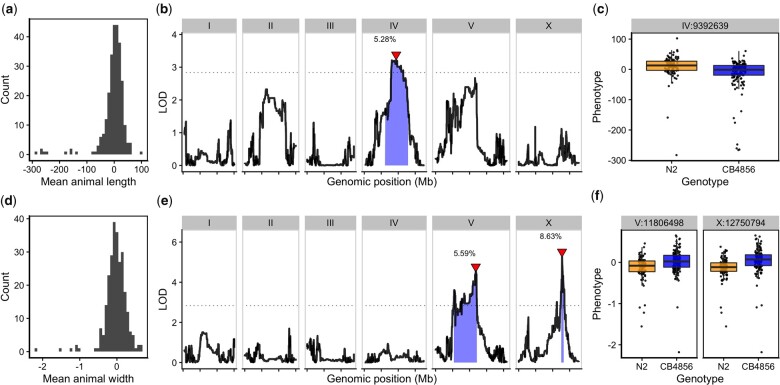
Fig. 2.
Linkage mapping identifies 3 QTL associated with body growth. Histogram of residual mean body length (a) and mean body width (d) of the RIAIL population. b, e) Linkage mapping results for mean body length or mean body width are shown with genomic position (x-axis) plotted against the LOD score (y-axis). X-axis tick marks denote every 5 Mb. Significant QTL are denoted by a red triangle at the peak marker, and blue shading shows the 95% confidence interval around the peak marker. The 5% genome-wide error rate LOD threshold is represented as a dashed horizontal line. The percentage of the total phenotypic variance in the RIAIL population that is explained by each QTL is shown above the peak marker. c, f) Tukey box plots show the residual mean length or width (y-axis) of RIAILs split by genotype at the marker with the maximum LOD score (x-axis). Populations of recombinant strains were grown in independent wells. Each point corresponds to the mean value calculated from each assayed well. Boxes for data from strains with the N2 allele are colored orange, and boxes for data from strains with the CB4856 allele are shown in blue.

