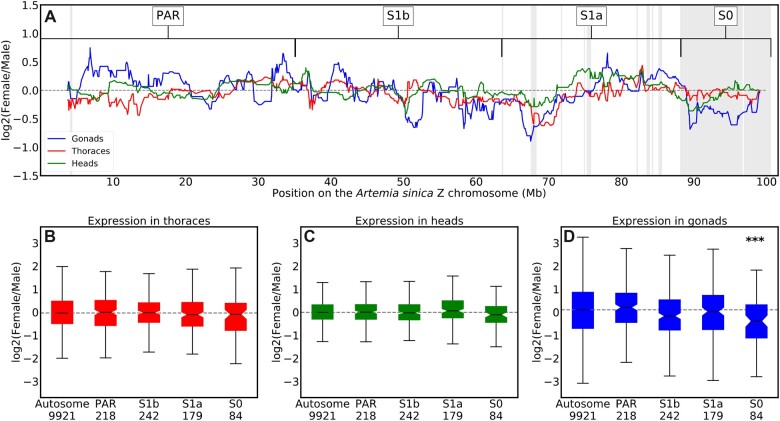
Fig. 2.
Dosage compensation of the Z-chromosome. a) The log-transformed ratio of female to male expression along the Z chromosome in heads, gonads, and thoraces (computed as the rolling median in sliding windows of 30 consecutive genes). Shaded areas represent the differentiated regions identified in the coverage analysis, and the putative strata are denoted above, along with the putative pseudoautosomal region (PAR). The dashed horizontal line is at zero. The distribution of log-transformed ratio of female to male expression for the autosomes and the different regions of the Z chromosome in thoraces (b), heads (c) and gonads (d). The number of genes in each of the different regions is indicated underneath the x-axis labels. A Wilcoxon rank sum test was used to assess the significance of the difference between the expression of the autosomes and the different regions of the Z chromosome, with a Bonferroni correction for the 4 comparisons performed in each tissue. ***P-value ≤ 0.001.

