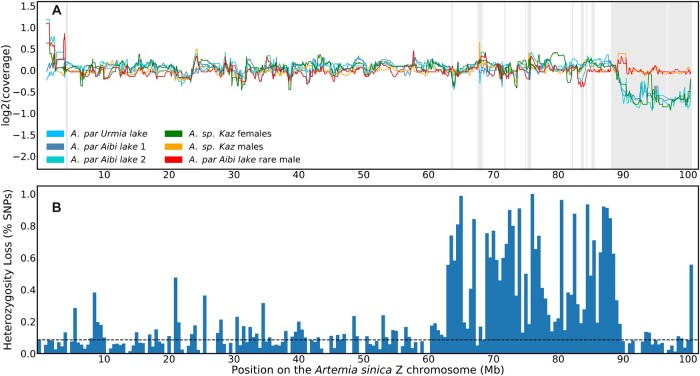
Fig. 3.
The sex chromosomes of sexual and asexual individuals. a) Coverage patterns in A. sp. Kazakhstan male and female samples, in 3 asexual females, and in a rare male derived from an asexual lineage from Aibi Lake. Shaded areas represent the differentiated regions of the A. sinica ZW pair. b) The fraction of SNPs that lost heterozygosity on the rare male Z chromosome relative to its asexual sister in bins of 500 kb. The dashed line represents the average loss of heterozygosity for autosomes.

