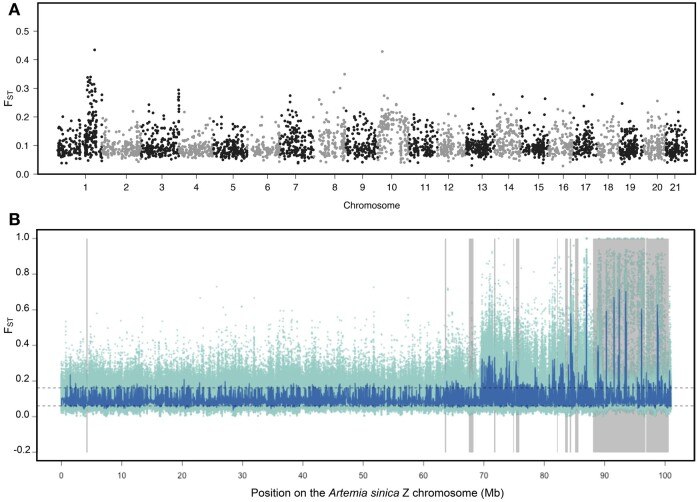
Fig. 4.
Elevated FST between sexual and asexual females localizes to the Z chromosome. a) Manhattan plot of FST estimated for 1 kb sliding windows between asexual and sexual females across the genome. b) FST across chromosome 1. FST is shown for individual SNPs in light green dots, and the dark line shows the rolling median for 101 SNPs. The dashed lines represent the 2.5% and 97.5% percentiles of autosomal rolling medians. Areas shaded in gray represent the differentiated regions of the A. sinica ZW pair.

