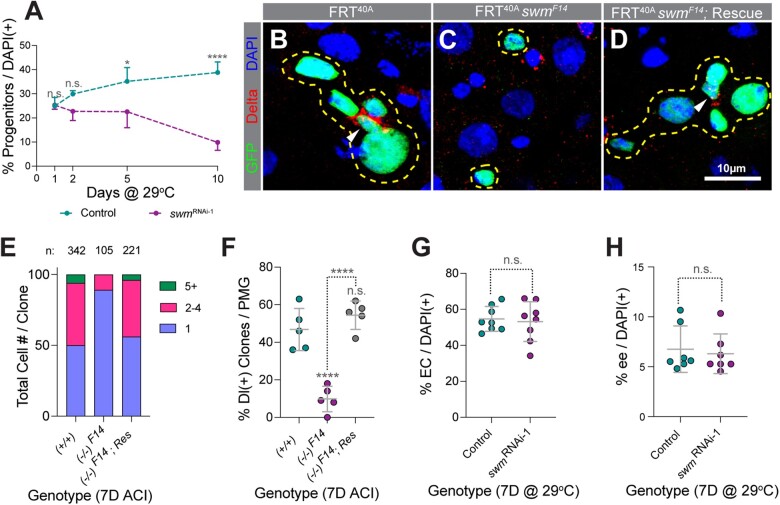
Fig. 2.
Depletion of swm results in loss of intestinal progenitor cells. a) Normalized progenitor percentage of esgTS and esgTS; swmRNAi-1 after 1, 2, 5, and 10 days at 29°C (n = 2,689, 4,268, 3,702, and 4,097 for esgTS and 13,040, 4,265, 2,811, and 2,023 for esgTS; swmRNAi-1 total cells from 7 to 8 intestines at the 1D, 2D, 5D, and 10D timepoints, respectively). Representative images of tub-GAL4, UAS-GFP- labeled (b) control, (c) swmF14, and (d) rescued swmF14 homozygous clones stained for Delta (red), GFP (green), and DAPI (blue). Clones are outlined in yellow and ISCs are indicated with white arrow heads. (e) Binned bar plot showing the proportion of total cell number per clone in tub-GAL4, UAS-GFP-labeled control, swmF14, and rescued swmF14 intestines analyzed 7 days ACI. Number of clones per genotype is indicated as n. f) Scatter dot plot of the same samples as in (e) showing the percentage of clones per PMG containing at least one Dl+ ISC. Scatter dot plots showing (g) normalized EC percentage in mex1-GAL4TS (n = 1,610) and mex1-GAL4TS; swmRNAi-1 (n = 1,363) and (h) normalized ee percentage in prosV1-GAL4TS (n = 1,870) and prosV1-GAL4TS; swmRNAi-1 (n = 1,859) intestines analyzed after 7 days at 29°C (n = total cells counted from 6 to 8 intestines). Error bars on plots show mean ± SD and asterisks denote statistical significance from Kruskal–Wallis test (a), ordinary one-way ANOVA (f), and unpaired t-test (g and h). *P < 0.05; **P < 0.01; ***P < 0.001; **** P < 0.0001; n.s., not significant. Complete genotypes are listed in Supplementary Table 1. ACI, after clone induction; EC, enterocyte; ee, enteroendocrine cell; Dl, delta; PMG, posterior midgut.

