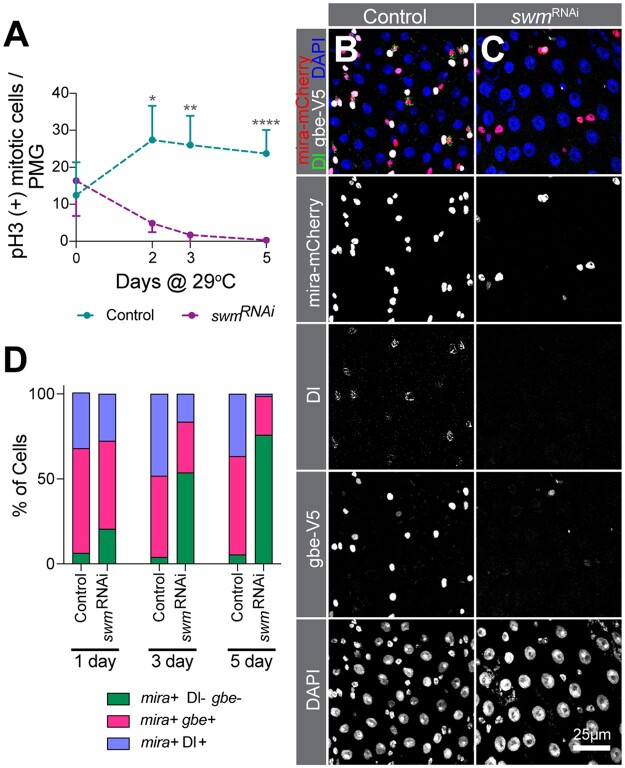
Fig. 3.
Loss of swm leads to loss of ISC/EB activity and identity. a) pH3 (+) cell number per PMG (n = 7 or 8 intestines) of bleomycin fed esgTS and esgTS; swmRNAi-1 intestines after 0, 2, 3, and 5 days at 29°C. PMG section from control (b) and swmRNAi-1 (c) after 5 days at 29°C stained for Ps (anti-RFP for mira-mCherry, in red), ISCs (anti-Dl, in green), EBs (anti-V5 for gbe-smGFP.V5.nls, in white) and all nuclei (DAPI, in blue). Individual channels are shown in gray scale. (d) Binned bar plot showing the quantification of percentage of mira+Dl-gbe- (no defined identity), mira+gbe+ (EB), and mira+Dl+ (ISC) of intestines from genotypes shown in (b) and (c) after 1, 3, and 5 days at 29°C. See Supplementary Fig. 3, a–d for additional statistics. Error bars on plots show mean±SD and asterisks denote statistical significance from Kruskal–Wallis test (a). *P < 0.05; **P < 0.01; ***P < 0.001; ****P < 0.0001; n.s., not significant. Complete genotypes are listed in Supplementary Table 1. P, progenitor cell; ISC, intestinal stem cell; EB, enteroblast; Dl, delta; PMG, posterior midgut.

