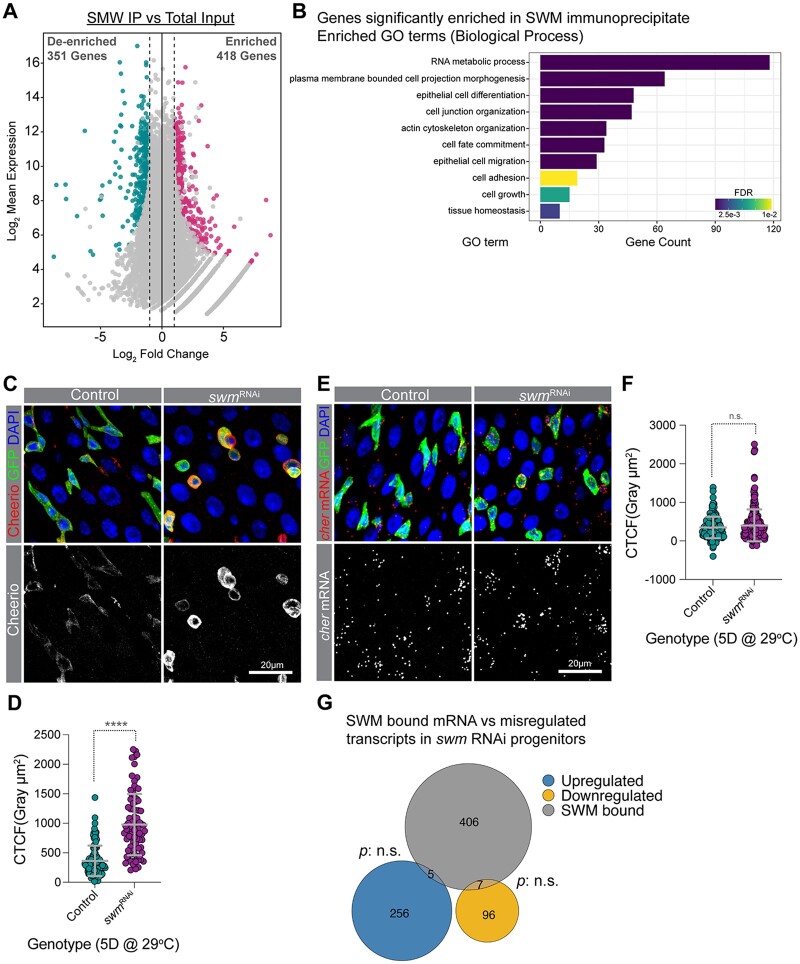
Fig. 5.
Swm binds and post-transcriptionally regulates transcripts related to cell adhesion. a) A scatter dot plot visualizing differentially enriched genes in SWM IP vs total input. Each dot represents a single gene. Cyan and pink dots indicate genes with a false discovery rate (FDR) adjusted P-value <0.05 and a Log2 fold change <−1 or >1, respectively. b) A bar plot showing a selected set of significantly enriched GO terms (biological processes) for genes that are physically associated with Swm. c) Representative confocal micrographs from PMGs of esgTS control (left) and esgTS; swmRNAi-1 (right) after 5 days at 29°C stained for Cheerio (red) and DAPI (blue). Ps are labeled with GFP in green. Bottom panel shows Cheerio staining in gray scale. d) Scatter dot plot of normalized Cheerio fluorescence intensity (corrected total cell fluorescence, CTCF) of progenitor cells from esgTS (n = 95 cells, 8 intestines) and esgTS; swmRNAi-1 (n = 84 cells, 7 intestines) after 5 days at 29°C. e) Intestinal progenitors from PMGs of esgTS control (left) and esgTS; swmRNAi-1 (right) after 5 days at 29°C labeled cheerio mRNA (red), Ps stained for GFP (anti-GFP in green) and nuclei with DAPI (blue). Bottom panel shows cheerio mRNA in gray scale. f) Scatter dot plot of normalized cheerio mRNA fluorescence intensity (CTCF) of progenitor cells from genotypes in F (n = 167 cells, 7 intestines for esgTS and n = 241 cells, 10 intestines for esgTS; swmRNAi-1). g) Venn diagram showing the overlap between genes enriched in SWM-CLIP (gray) and genes that are upregulated (blue) or downregulated (yellow) in swm depleted progenitor cells identified from RNAseq. Error bars on plots show mean ± SD and asterisks denote statistical significance from Mann–Whitney test (d, f). *P < 0.05; **P < 0.01; ***P < 0.001; ****P < 0.0001; n.s., not significant. Complete genotypes are listed in Supplementary Table 1. PMG, posterior midgut; P, progenitor cell; CTCF, corrected total cell fluorescence.

