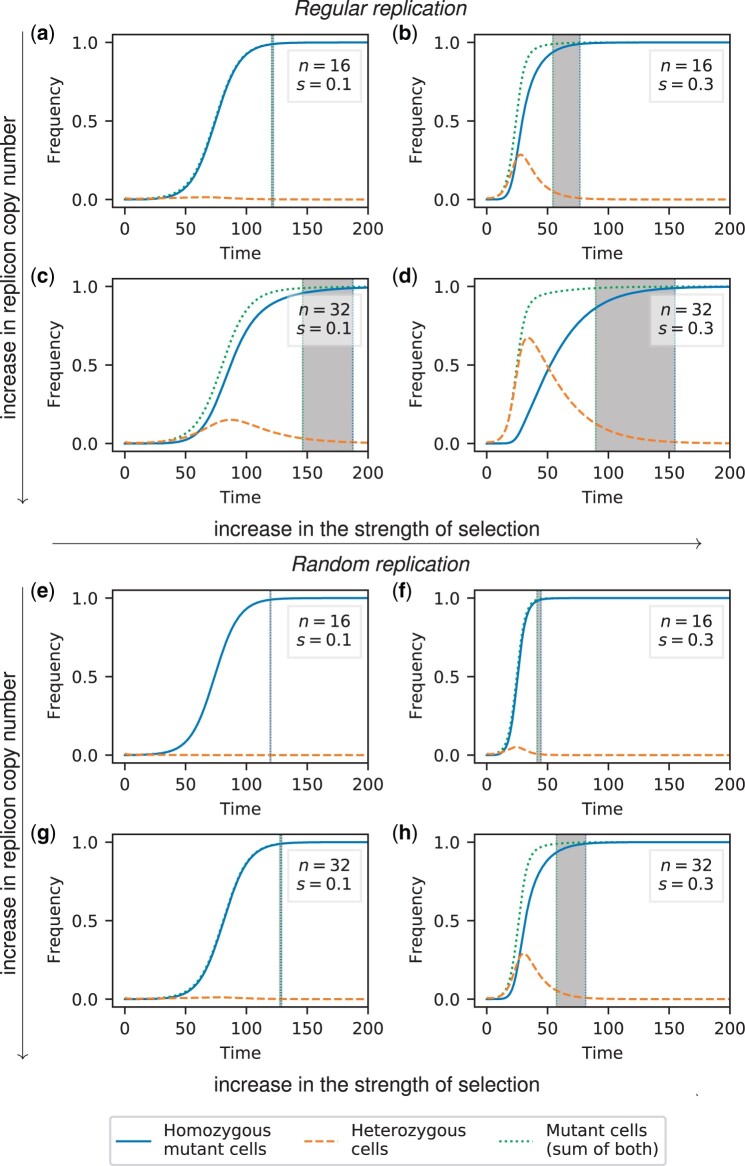
Fig. 2.
Frequency trajectories of different cell types for random segregation and regular replication (a–d) or random replication (e–h). The initial population at t = 0 comprises a small fraction f = 0.01 of heterozygous cells with one mutant replicon copy each. The gray area highlights the heterozygosity window, defined as the time between fixation of the mutation at the phenotype level (99% of cells carry at least one mutant copy) and fixation at the genotype level (99% of cells are mutant homozygotes). The time unit corresponds to the generation time of the wild type. Results for cell frequencies were obtained from numerical integration of the ordinary differential Equation (A11).

