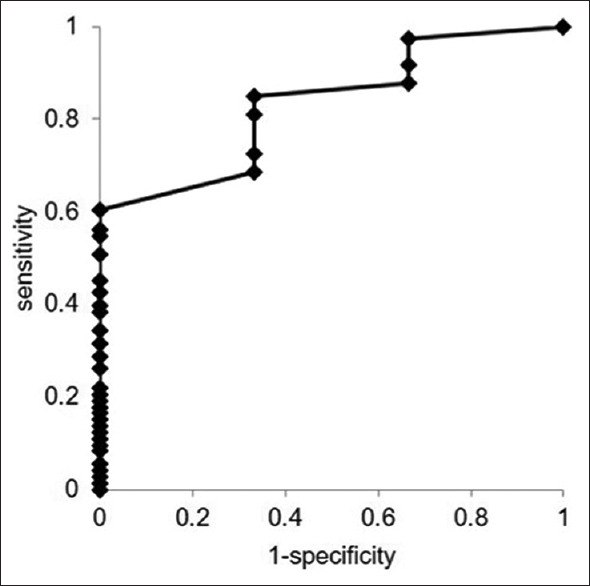
Figure 4.

Comparison of core tissue amount measured by the AMUS affecting the histological diagnosis as determined by ROC analysis. The AUC of the ROC curves calculated for the whitish core affecting the histological diagnosis was 0.83 (95% CI: 0.63–1.04; P < 0.01). AMUS: Automated multiband imaging system; ROC: Receiver-operating characteristic; AUC: Area under the curve; CI: Confidence interval
