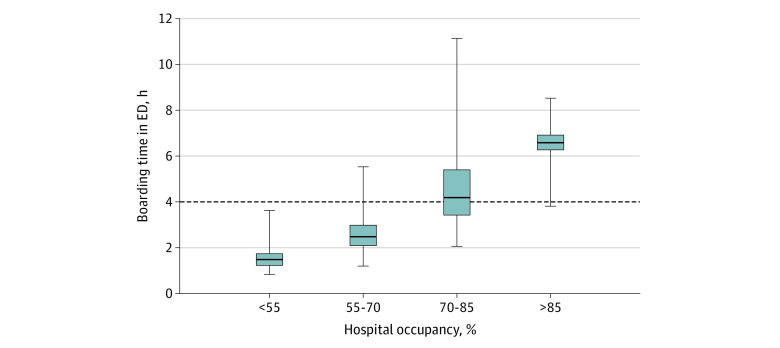
Figure 1. Median Boarding Time by Occupancy Across Sample Hospitals.
Data are from Epic Systems Corporation peer benchmarking. Center horizontal lines represent medians; lower and upper bounds of the boxes, 25th and 75th percentiles; vertical lines, 5th to 95th percentile; and dashed horizontal line, 4-hour standard set by The Joint Commission.

