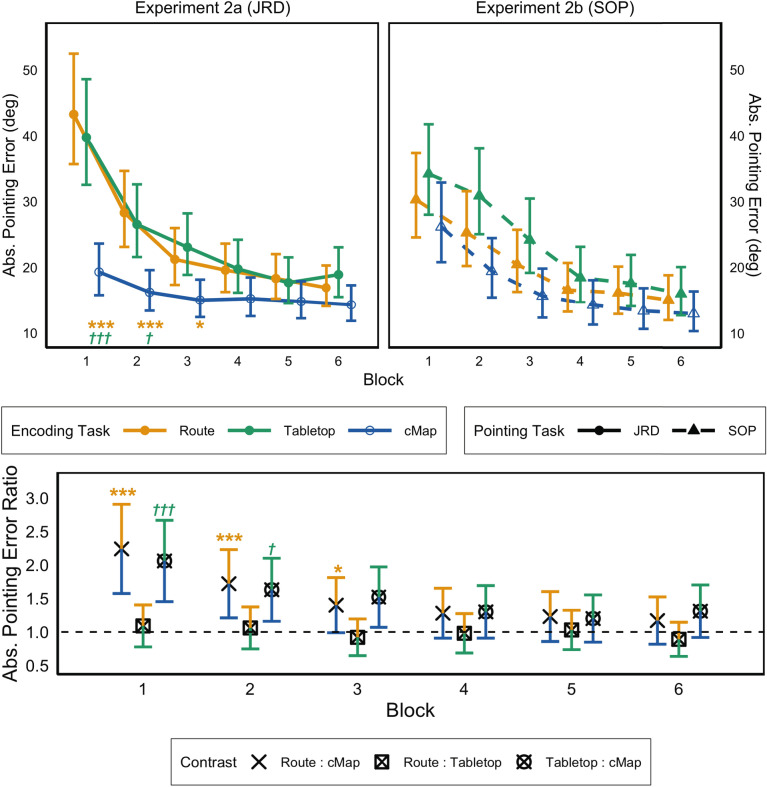
Fig. 5.
Pointing Task Performance in Experiment 2. The upper panel shows absolute pointing error sample means and variability back-transformed from log values (i.e., exponentiated) for qualitative interpretation. Performance after route encoding is shown in solid orange (solid light gray), after tabletop navigation is shown in solid green (solid dark gray), and performance after criterion map encoding is shown in outlined dark blue (outlined dark gray). Error bars represent the standard error of the mean. The lower panel depicts the pairwise contrasts for the JRD task from Experiment 2a as ratios (i.e., the difference in log means represented as the ratio of back-transformed means). Unbounded “” symobls represent the route:cMap contrast ratio, “” symbols bounded by a square represent the route:tabletop contrast ratio, and “” symbols bounded by a circle represent the tabletop:cMap contrast ratio. Error bars represent 95% confidence intervals for the contrast ratio; colors represent the exact contrast tested (e.g., orange on top with blue on bottom shows route:cMap contrast). cMap criterion map, JRD judgments of relative direction, SOP scene- and orientation-dependent pointing. *p < 0.05, uncorrected. ***p < 0.001, uncorrected. †p < 0.05, corrected. †††p < 0.001, corrected (color figure online)

