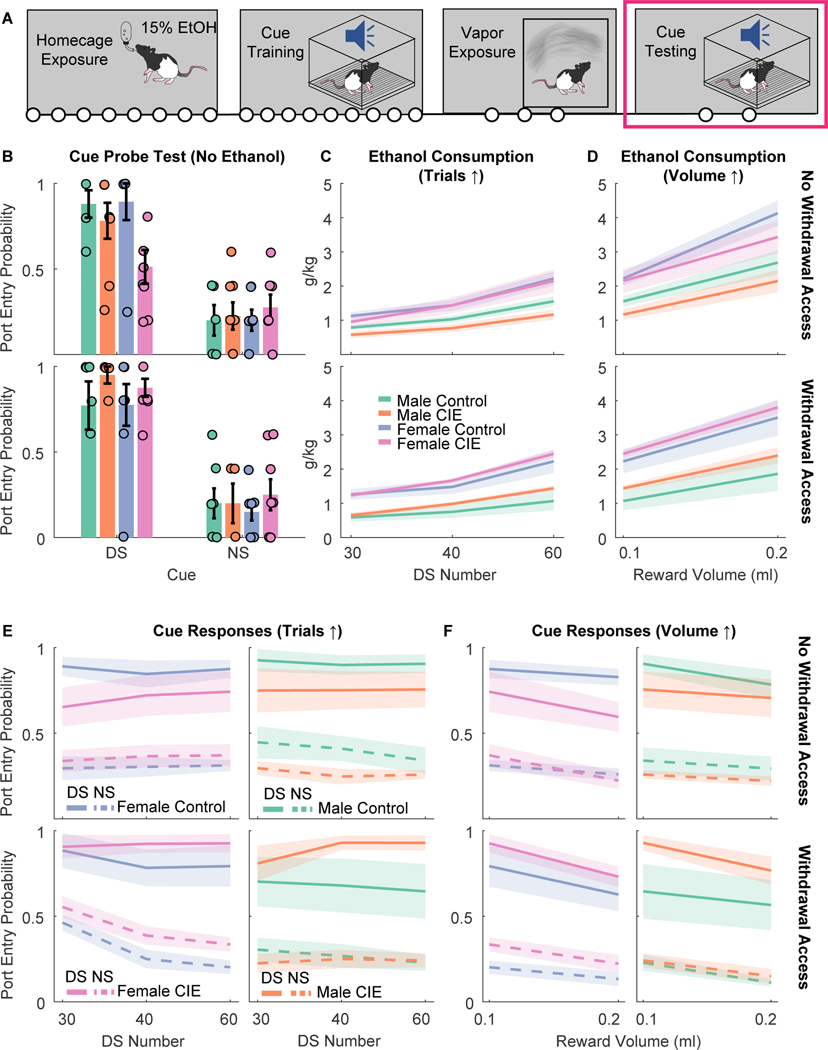
Figure 2. Cue responses and ethanol consumption in the DS task after vapor exposure.
A) Timeline of experiments. Following homecage ethanol exposure, cue training and ethanol vapor exposure, rats underwent cue testing. Circles indicate the number of weeks in each experimental phase. B) Port entry probability during the DS (left) or NS (right) in the cue probe test (no ethanol delivered) after being exposed to vapor (CIE) or control conditions. Rats are split into those that did not receive alcohol access during acute withdrawal in the vapor phase (top) or rats that did receive access in acute withdrawal (bottom). Circles represent data from individual animals. Bar plots with error bars indicated mean +/− SEM. C) Ethanol consumption during cue “retraining” and testing in which ethanol was re-introduced, and the number of trials was increased across sessions, in rats that received vapor exposure (CIE) or control conditions after task training. Lines with shading indicate mean +/− SEM. D) Ethanol consumption during cue testing in which the amount of 15% ethanol delivered on each trial was increased from 0.1 to 0.2 ml. E) Port entry probability during the DS (solid lines) or NS (dotted lines) during cue “retraining” and testing in which ethanol was re-introduced, and the number of trials was increased across sessions. F) Port entry probability during the DS and NS during cue testing in which the amount of 15% ethanol delivered on each trial was increased from 0.1 to 0.2 ml.

