Figure 2.
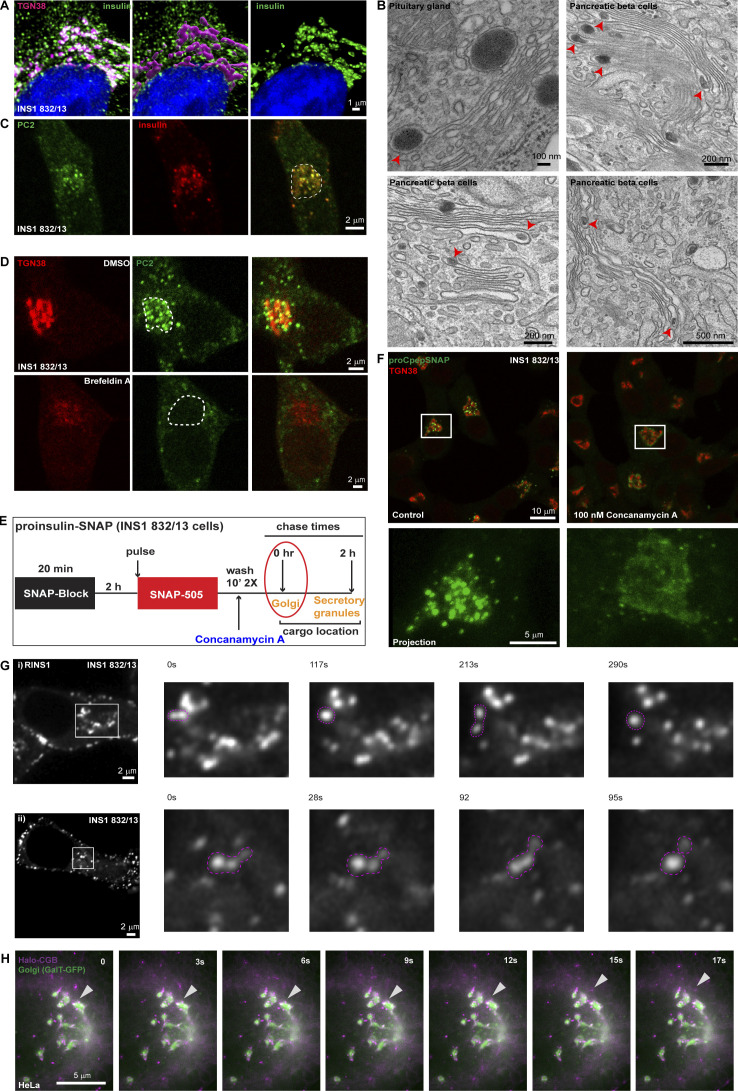
Insulin is distributed in dynamic punctate structures at the Golgi apparatus. (A) INS1 832/13 cells were immunostained for insulin (pan-insulin antibody; green), TGN38 (magenta) and counterstained with DAPI (blue). The middle image demonstrates 3D-rendering of the TGN38 volume mask which was used for image segmentation to specifically examine insulin staining within the TGN (right image). (B) A panel of electron micrographs from cells of pituitary gland and mouse islets demonstrating condensed structures within the Golgi lumen. (C) Representative images from a single slice from a confocal image of INS1 832/13 cells stained with the insulin processing enzyme protein convertase 2 (PC2; green) and insulin (pan-insulin antibody; red). Note the colocalization of proinsulin puncta with PC2 at the Golgi apparatus which is outlined in the merge image using dashed lines. (D) Images obtained from INS1 832/13 cells which were stained with TGN38 (red) and PC (green), treated with either 0.05% DMSO (control; top) or 5 µg/ml Brefeldin A (bottom). Shown here is a single slice from a confocal stack. Note the disassembly of TGN38 based on staining upon Brefeldin A treatment which is accompanied by a loss of PC2 puncta in the perinuclear region, marked using dashed line. (E) A schematic description of a pulse-chase assay in INS1 832/13 cells stably expressing SNAP-tagged proinsulin. Cells are initially incubated with a non-fluorescent blocking probe to mask the existing proteins in the cells. After 2 h, cells are labeled with SNAP-505 to mark the newly synthesized proteins (20 min). After two washes in growth medium either in presence or absence of concanamycin A (control), cells are fixed immediately to monitor the pulse of new synthesized proinsulin arriving at the Golgi apparatus. (F) Representative images at the top show single slice from a confocal image of INS1 832/13 cells labeled with SNAP-505 (green) to monitor newly arrived proinsulin at the TGN (red) in control (left) and concanamycin A (right) treatment. The insets below are zoomed in images from a single cell to highlight the punctate vs diffuse distribution of proinsulin at the TGN in control (left) and concanamycin A (right) treatment. (G) A panel of images extracted from a movie from live imaging of INS1 832/13 cells transiently transfected with RINS1, a fluorescent insulin reporter construct. Dynamics of the punctate structures (pink dashed line) are captured in the image sequence where structures undergo fission or fusion events. Images shown here are single confocal slices upon imaging in the conventional confocal mode (i) or in the airy scan confocal mode (ii). Images have been smoothened using the function in ImageJ for visual representation purposes. (H) A panel of images extracted from a movie from live imaging of HeLa cells expressing Halo-RUSH-CGB (magenta) and GalT-GFP (green) to monitor the budding of CGB granules from the Golgi. The arrowhead denotes a budding event from the Golgi.

