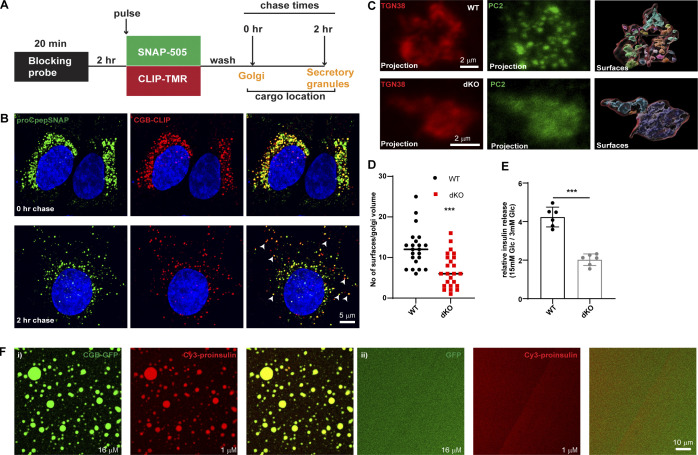
Figure 3.
Proinsulin co-traffics with CGB in vivo and is recruited to droplets in vitro. (A) Schematic depiction of dual pulse chase experiment in INS1 832/13 cells expressing SNAP tagged insulin (proCpepSNAP) and CLIP tagged CGB (CGB-CLIP). Cells are initially incubated with a non-fluorescent blocking probe to mask the existing proteins in the cells. After 2 h, cells are incubated with medium containing SNAP 505 and CLIP-TMR to label the newly synthesized proteins (20 min). After three washes in growth medium, cells are fixed immediately (0 h chase) when majority of the cargo is at the Golgi apparatus or after a chase of 2 h where most of the cargo has moved to the SG in the cytoplasm. (B) Top panel shows confocal images form INS1 832/13 cells expressing SNAP tagged insulin (proCpepSNAP; green) and CLIP tagged CGB in red and fixed immediately after labeling with fluorescent probes, SNAP-505 and CLIP-TMR to monitor the Golgi resident (peri-nuclear) pool of the proteins. Bottom panels show images after a 2 h chase and the arrows point to some of the colocalizing structures which are cytoplasmic SGs. (C) INS1 832/13 wild-type (top) and CGA/CGB dKO (bottom) cells fixed and labeled with antibodies to TGN38 (red) and PC2 (green). Left and the middle images are extracted from a 3D projection. The image on the right represents surfaces which were created using the TGN38 staining (red outline) on deconvolved images in Imaris. The TGN38 volume mask was then used to generate distinct surfaces in the PC2 channel. (D) A scatter plot (median) depicting differences in the numbers of PC2 surfaces between wild-type and CGA/CGB dKO cells from 22 wild-type and 24 dKO cells. Statistical analysis was performed using Mann–Whitney test. ***P < 0.001. (E) Graph showing normalized glucose stimulated insulin secretion (GSIS; stimulated/basal) in wild-type, CGA/CGB dKO cells. Data is represented as mean ± SD from six independent experiments. Statistical analysis was performed using unpaired two-tailed t test. ***P < 0.001. (F) CGB-GFP (16 µM; green) was mixed with Cy3 tagged proinsulin (1 µM; red) in (i). Tagged proinsulin gets recruited to the CGB-GFP droplets as evident from the colocalization image. When GFP (16 µM; green) is mixed with Cy3 tagged proinsulin (1 µM; red) in (ii), no droplets are seen either with GFP or proinsulin indicating that GFP or Cy3-proinsulin are incapable of forming droplets on their own at these concentrations.

