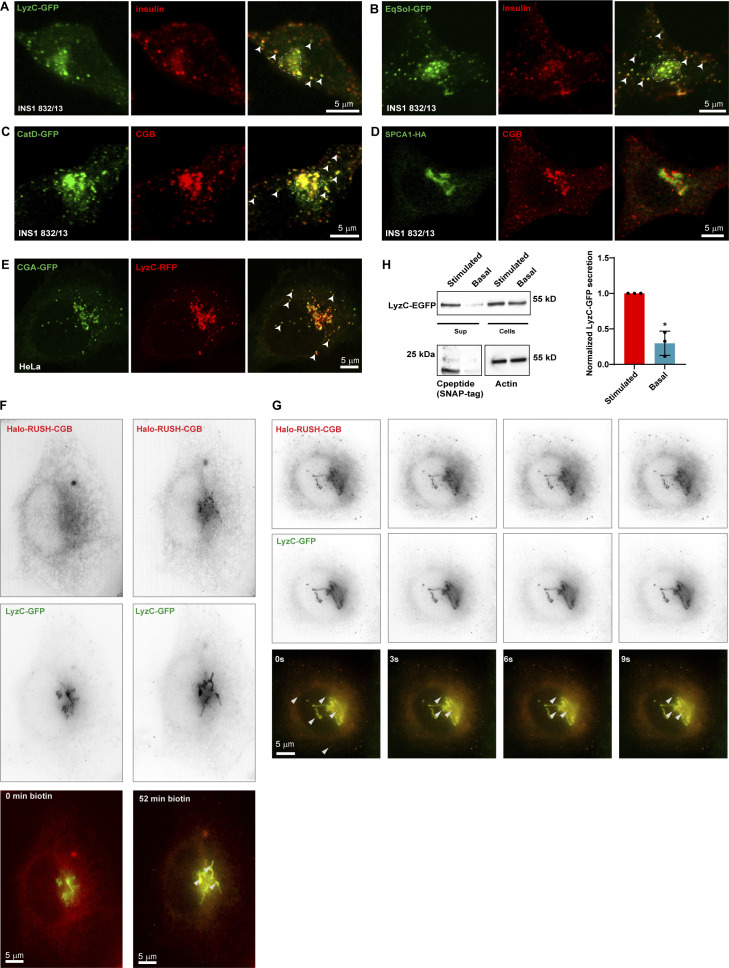
Figure 4.
Ectopic expression of soluble secreted proteins in INS1 832/13 cells results in their routing to insulin granules. (A and B) Representative images from INS1 832/13 cells expressing LyzC-GFP (A; green) or EqSol-GFP (B; green) and stained with insulin antibody (red) to observe the localization of the ectopically expressed proteins with respect to insulin granules. Images are average projections from two slices from a confocal stack. Arrowheads point to cytoplasmic insulin granules which also shows the presence of LyzC-GFP and EqSOL-GFP respectively, in E and F. (C) Representative images from INS1 832/13 cells stably expressing CatD-GFP (green) and labeled with CGB antibody to observe the localization of ectopically expressed CatD-GFP with respect to SGs. Images are average projections from two slices from a confocal stack. Arrowheads point to some of the cytoplasmic SG, which shows colocalization of CGB and CatD-GFP. (D) Representative images from INS1 832/13 expressing HA-tagged version of the calcium ATPase, SPCA1 (green) and stained using CGB antibody (red). Images are a single slice from a confocal stack. Note that overexpressed SPCA1 remains localized at the Golgi apparatus with no signal seen from the CGB containing SGs. (E) Representative images from HeLa cells stably expressing CGA-GFP and transfected with LyzC-RFP. Images are a single slice from a confocal stack imaged in the airy-scan mode. The arrowheads point to some of the ectopic granule-like structures seen in HeLa cells upon expression of CGA-GFP. Note that LyzC-RFP gets routed to these ectopic granule-like structures. (F) Images extracted from live imaging of HeLa cells co-expressing Halo-RUSH-CGB (red) and LyzC-GFP (green) before and after addition of biotin for 52 min when CGB appears at the Golgi. (G) Images extracted from live imaging of HeLa cells co-expressing RUSH-CGB (red) and LyzC-GFP (green) after biotin addition and images after arrival of CGB at the Golgi. Arrow heads point to colocalizing structures at the Golgi and vesicles in the cytoplasm. (H) Western blot at the top shows bands for LyzC-GFP, probed using α-GFP antibody, in supernatant and lysates from INS1 832/13 cells stable expressing SNAP-tagged proinsulin. The basal condition represents cells grown in 3 mM glucose in serum-free medium and the stimulated condition represents cells grown in 15 mM glucose in serum-free medium, also containing 35 mM potassium chloride. Note the stronger band intensity in the supernatant in stimulated condition compared to the basal condition, although the levels in cell lysates are the same. The blot in the bottom left detects the presence of SNAP-tagged C-peptide, probed using α-SNAP-tag antibody, which is used as a proxy to measure insulin secretion. Again, the signal intensity of the band is stronger in stimulated condition as compared to the basal condition. The blot on the bottom right depicts actin bands in cell lysates obtained from basal and stimulated conditions. The graph quantifies secretion of LyzC-GFP normalized with levels in cell lysates in basal and stimulated conditions. Value of the band intensity in secreted compared to the band intensity in cell lysates was set to 1 for stimulated condition in each experiment. Data is represented as mean ± SD from three independent experiments. Statistical analysis was performed by two-tailed one-sample t test *P = 0.019. Source data are available for this figure: SourceData F4.

