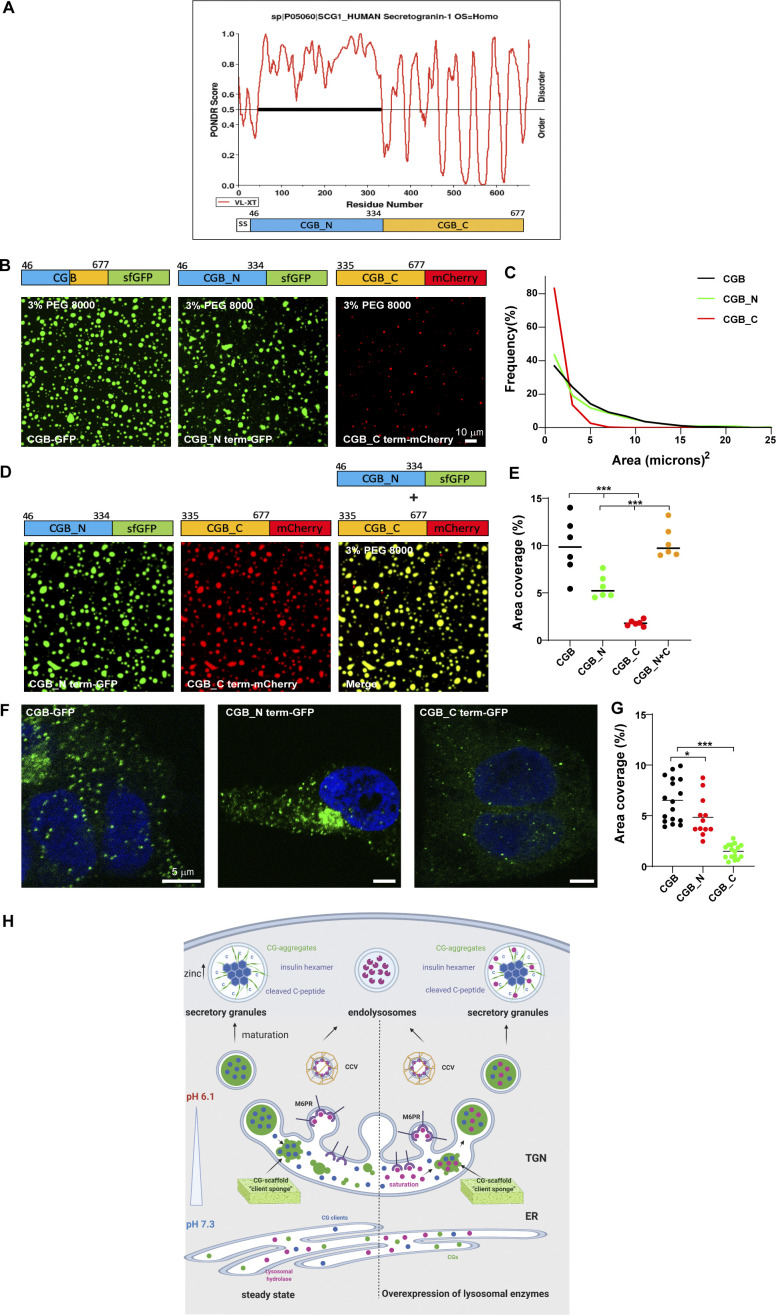
Figure 6.
In vitro and in vivo phenotypes associated with truncation mutants of CGB. (A) Plots of CGB generated using PONDR (VL-XT algorithm) depicting disordered regions in the protein. Based on the PONDR scores, amino acids 46–334 are highly unstructured, thus showing a high degree of disorder compared to residues 335–677. (B) Representative images showing a comparison of condensates of full-length CGB-GFP, CGB_N term-GFP, and CGB_C term-mCherry, respectively. Droplet formation was initiated at pH 6.1 with 2 µM protein in the presence of 3% PEG 8000. (C) Histogram represents the frequency distribution of size of condensates for each of the three proteins. Area was quantified from 2610 droplets for CGB-GFP, 1450 droplets for CGB_N term-GFP, and 1716 droplets for CGB_C term-mCherry. Note that the size of the droplets is larger for CGB-GFP, CGB_N term-GFP compared to CGB_C term-mCherry. (D) Representative images of droplet formation obtained upon mixing CGB_N term-GFP (green) and CGB_C term-mCherry (red). Droplet formation was initiated at pH 6.1 upon mixing 2 µM protein of each protein in the presence of 3% PEG 8000. CGB_N term-GFP and CGB_C term-mCherry cooperatively form larger droplets together. (E) Scatter plot (median) quantifies area occupied by all the droplets in a field of view from a microscopy image. Data was pooled from 6 uniform fields of views. CGB-GFP > CGB_N term-GFP > CGB_C term-mCherry. Upon mixing CGB_N term-GFP with CGB_C term-mCherry, there is a restoration in the area covered by the condensates to the levels of the full-length protein. Statistical analysis was performed by unpaired two-tailed t test. ***P < 0.001. (F) Representative images of HEK293 cells expressing CGB-GFP (left), CGB_N term-GFP (middle) and CGB_C term-GFP (right) and induced with doxycycline for 10 h. Images were taken on a confocal microscope to observe ectopic granule-like structures in HEK293 cells, and the bottom-most plane of the cells plated on the coverslips was imaged. While CGB-GFP and CGB_N term-GFP expression induce formation of ectopic granules in HEK293 cells, much fewer granules are seen upon expression of CGB_C term-GFP. (G) Scatter plot (mean) quantifies the percentage area occupied by the ectopic granules as a fraction of total cell area. Data was obtained from 17 CGB-expressing cells, 12 CGB_N term-expressing cells and 16 CGB_C term-expressing cells pooled from two independent experiments. Statistical analysis was performed by unpaired two-tailed t test. *P = 0.043, ***P < 0.001. (H) Model presented summarizes our findings on the role of LLPS in receptor-independent cargo delivery from the TGN to the SGs. CGs undergo LLPS in the milieu of the TGN, behaving like a “cargo sponge” and recruit clients like proinsulin by the virtue of their relative abundance to the condensates. Lysosomal hydrolases would be sorted to the endolysosomes via the mannose-6-phosphate receptor pathway. However, upon overexpression, the receptors are saturated and hence owing to their smaller size and high abundance at the TGN, they get sucked into the CG condensates and hence delivered to the SGs. As the SGs mature, the presence of high zinc concentrations leads to hexamerization of insulin after its proteolysis. CGs can undergo aggregation and could represent one of the possible mechanisms for cargo segregation within the SGs.

