Figure S1.
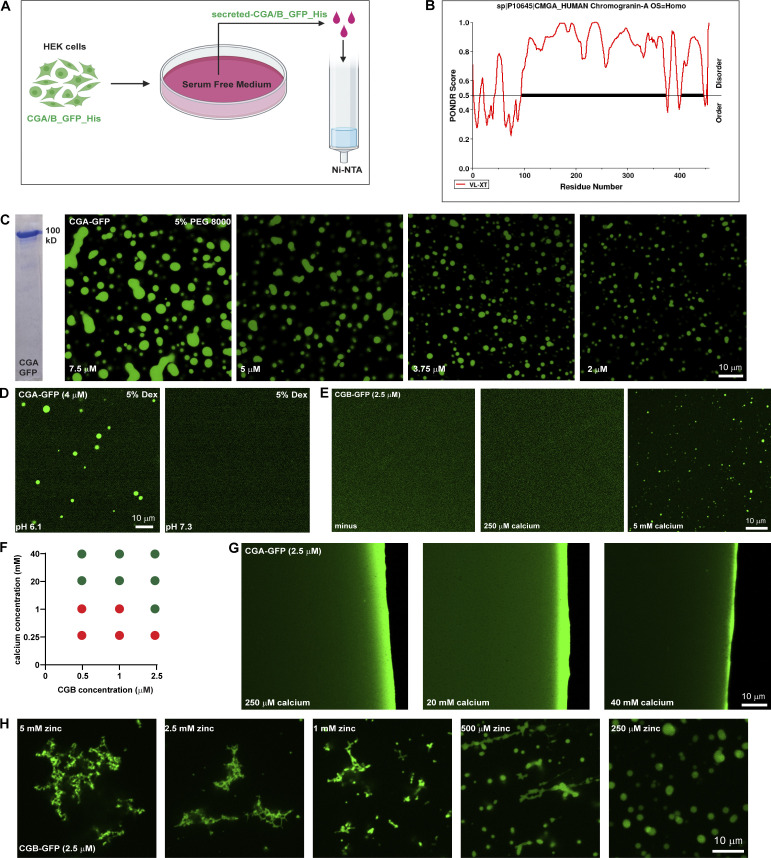
In vitro characterization of CG LLPS. (A) Scheme used for purifying GFP and 6x-His-tagged CGA or CGB, respectively. Stable lines expressing CGB-GFP and CGA-GFP under a doxycycline-inducible promoter are treated with doxycycline and the calcium ionophore A23187 to induce secretion of the respective proteins in serum-free medium, which is then used for purification using Ni-NTA affinity columns. (B) Plot of CGA generated using PONDR depicting disordered regions in the proteins. Almost 90% of CGA is disordered when analyzed using the VL-XT algorithm. (C) Coomassie-stained gel depicting purified CGA-GFP. Images showing different droplets of CGA-GFP at different protein concentrations at pH 6.1 in presence of 5% PEG 8000. Note that the size of the condensates decreases with decreasing protein concentration. (D) Representative images of solutions containing CGA-GFP buffered at either pH 6.1(left) or pH 7.3 (right). Droplet formation occurs at pH 6.1 and not at pH 7.3. Droplets of CGA-GFP were induced at 4 µM protein concentration in presence of 5% dextran. (E) Images obtained from plating a solution of CGB-GFP (2.5 µM final concentration) to monitor the presence or absence on liquid-like condensates either without or with 250 µM or 5 mM calcium. Note that droplet formation is induced only in the presence of 5 mM calcium. (F) Phase diagram obtained by varying calcium and CGB concentrations after plating solutions on imaging dishes and observing after 15–20 min. Red circles indicate conditions where no droplets were seen, and green circles indicate conditions which favored presence of CGB droplets. (G) Images obtained from plating a solution of CGA-GFP (2.5 µM final concentration) in presence of either 250 µM, 20 or 40 mM calcium to test for the presence or absence of droplet formation. No droplets are seen even at 40 mM which is the highest calcium concentration. (H) Representative images of CGB-GFP (2.5 µM) in presence of different concentrations of zinc. At high concentrations zinc induces formation of insoluble aggregates but at low concentration, it induces CGB-GFP droplets. Source data are available for this figure: SourceData FS1.

