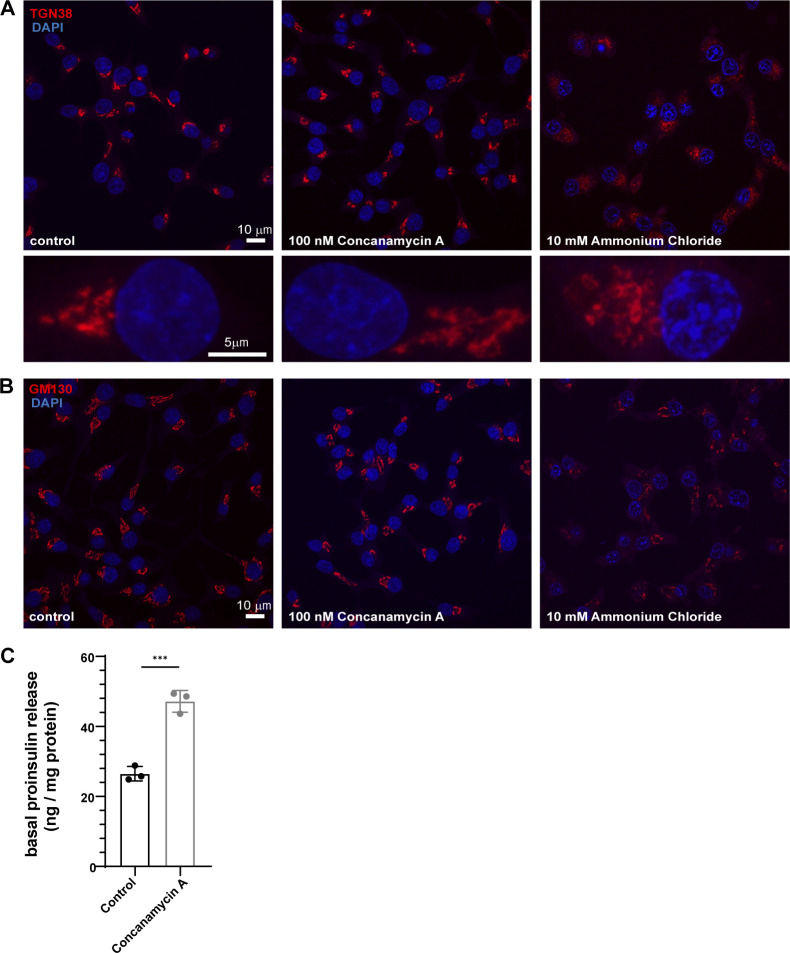
Figure S2.
Effects of concanamycin A on organization of Golgi apparatus and proinsulin secretion from INS1 832/13 cells. (A and B) INS1 832/13 cells fixed and labeled with antibodies to TGN38 in A; red, and GM130 in (B); red in control (left), 100 nM concanamycin A treatment for 20 min (middle) or 10 mM ammonium chloride treatment for 20 min (right). The rectangular boxes in A represent projection of zoomed images from a single cell. Not that while TGN38 staining looks similar to control cells upon concanamycin A treatment, it appears expanded and fragmented upon ammonium chloride treatment. The staining intensity is reduced upon ammonium chloride treatment and hence the scaling is not same for representation purposes. (C) Graph showing normalized proinsulin secretion (proinsulin secreted/total protein in cells) at steady state in presence of 3 mM glucose (basal) to monitor the secretion of proinsulin via the constitutive pathway in INS1 832/13 cells with and without concanamycin A treatment. Data is represented as mean ± SD from three independent experiments. Statistical analysis was performed using unpaired two-tailed t test. ***P < 0.001.

