Figure 3.
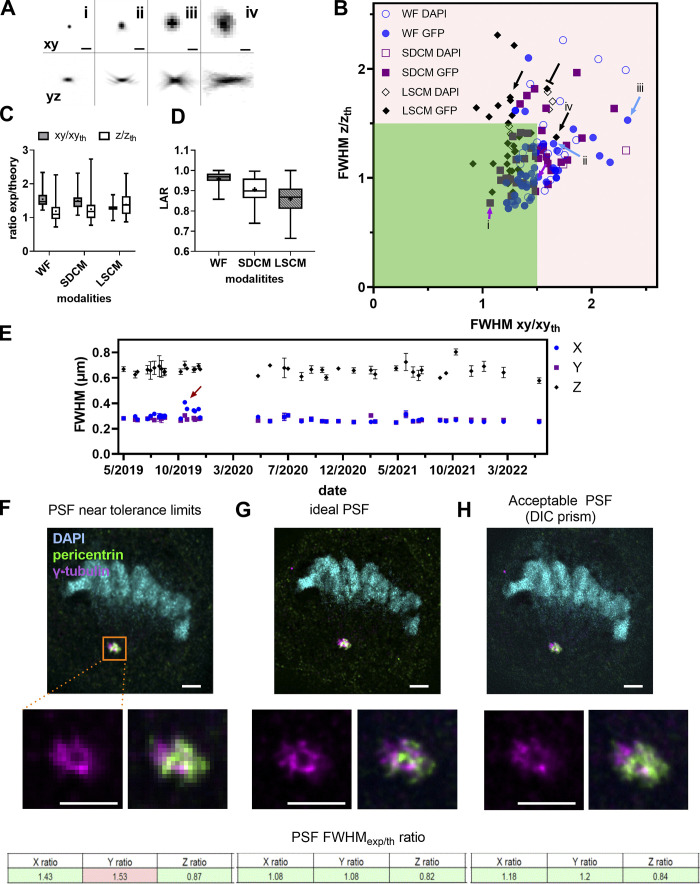
PSF distribution and influence on image quality of biological structures. (A) Square root PSF along xy and yz of four cases (i-iv) shown in B. Scale bar is 1 μm. (B) Ratio of experimental to theoretical lateral and axial PSF FWHM values for WF, SDCM, and LSCM techniques for the DAPI and GFP channels. The red arrows show PSF in the limit values, the blue arrows show PSF of medium quality, the black-capped arrow shows a 40× water immersion objective with an elongated z-axis PSF, and the black arrows show PSF cases from dry 20× objectives. (C) Statistical analysis with median (horizontal line), mean values (dot), SD (box) and min/max values (whiskers) of B. (D) Box plots summarizing the distribution of the LARs for the PSFs shown in B. Statistical significance was determined by using Kruskal–Wallis test (P value was <0.0001 [****]). For C and D, the independent n data points were 61, 43, and 37 for WF, SDCM, and LSCM, respectively. (E) Stability evolution of PSF over 32 mo for an upright WF microscope. The red arrow shows when the PSF is significantly different along the x axis. The gap in the dates of January 2020 corresponds to the COVID-19 lockdown when no experiments could be carried out. Error bars represent the SD. At least five PSFs were analyzed per date. (F–H) Degradation of image quality on a biological sample depends on PSF quality. The biological sample is a cell in division (anaphase state). The cell nucleus is labeled with DAPI (cyan), the pericentrin protein of the centrosome is labeled with Alexa Fluor 488 (green), and the γ-tubulin is labeled with Alexa Fluor 561 (magenta). The images are acquired with a SDCM, Plan-Apo 100×/1.45 objective. For each PSF case, we show the acquisition of the cell in three colors, the zoom of the centrosome region for one color and two-color overlay, and the PSF summary results of the mean FWHMexp/th for the three axes. Scale bar is 2 μm. (F) Imaging with a PSF FWHM ratio along the y axis that is out of the tolerance values due to oversampling (big pixel size). (G) Imaging with an ideal PSF (use of additional lenses inducing a 3× magnification to respect Nyquist criterion). (H) Imaging with an acceptable PSF: the added DIC prism introduces coma aberrations.

