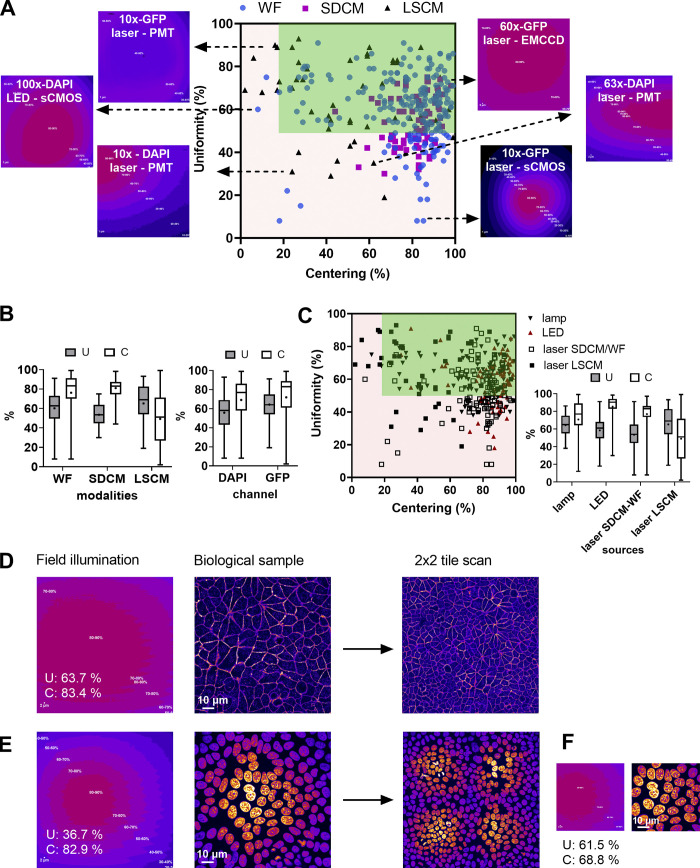
Figure 4.
Distribution of uniformity and centering field illumination flatness metrics and their influence on biological imaging. (A) Uniformity (U) and centering (C) distribution are classified into microscopy modalities, with representative field illumination pattern examples. (B) Statistical analysis of A, according to the modality and the excitation channel. The mean value is shown as a cross, the SD as a box and the whiskers correspond to the min and max. (C) U–C distribution classified into excitation source types with the statistical analysis study. (D–F) Influence of field illumination flatness on image quality of biological structures. The objective is a Plan-Apo 60×/1.4 (Nikon) on a spinning disk microscope (Dragonfly-Andor). (D) Field illumination pattern and U–C values for a plastic slide extracted by MetroloJ_QC, the corresponding image for a DAPI stained nuclei sample, and a 2 × 2 tile scan. (E) Same configuration as D for the GFP channel and actin Alexa Fluor 488 labeling. (F) The 50% central area of D with the U–C calculated metrics.

