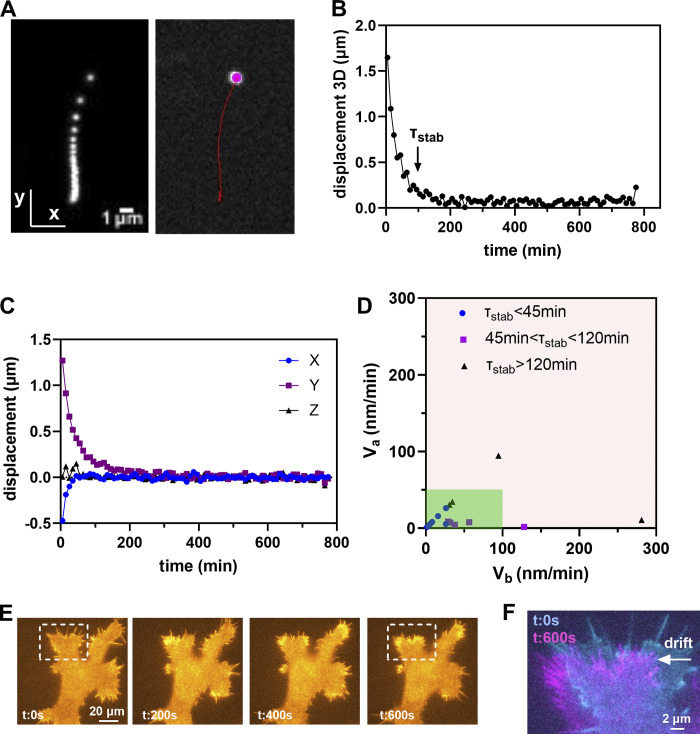
Figure 7.
Stage drift data summary. (A) Max Z projection of the time projection of a 15 h time-lapse of a fluorescent bead, and trajectory of the bead, with the initial segmented bead position shown in magenta. (B) Global 3D displacement over time. The arrow indicates the calculated stabilization time τstab. (C) Relative displacement along the xyz axes. (D) Calculated velocity before (Vb) and after (Va) stabilization of different microscope stages grouped in three categories upon τstab. The dark green zone highlights the acceptable values. (E) xy time lapse over 600 s of living cells labeled with CD63PhLuorin (membrane labeling). (F) Overlay of the initial t = 0 (cyan) and final t = 600 s (magenta) frame of the series of E to highlight the relative drift along the x axis.

