Figure 8.
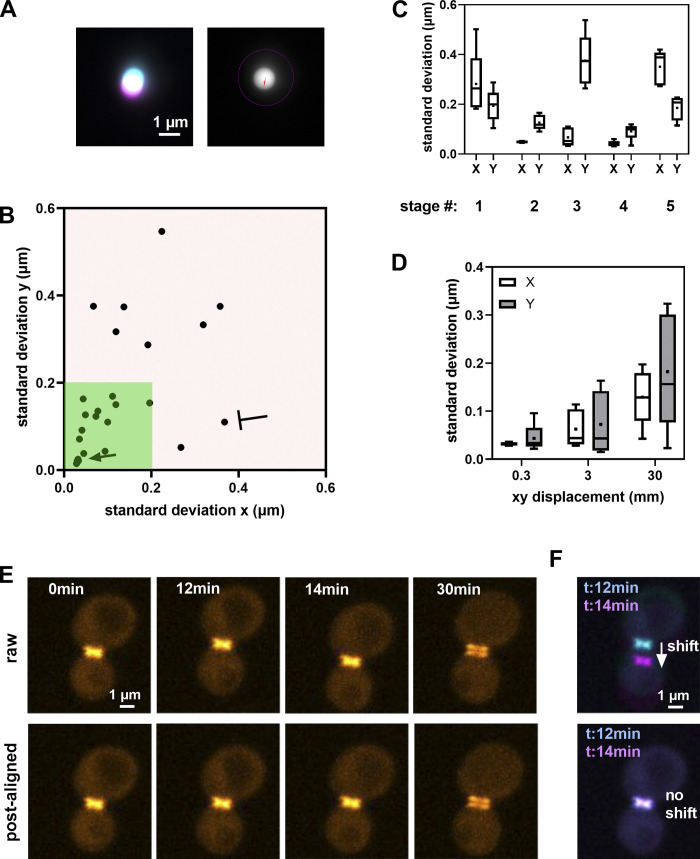
Stage positioning repeatability data summary. (A) Left: Time projection of the repeatability experiment for a fluorescent bead. Cyan and magenta represent the two extreme positions of the bead. Right: The calculated trajectory is shown with a red line. (B) Bidirectional stage repeatability for 3 mm displacements in both xy axes (4.2 mm diagonal). The arrow and capped line show the results of two linear stages (same model with encoders) tested on the same microscope stand. The dark green zone highlights the acceptable values. (C) Box plots summarizing the reproducibility in time (five different measurements per stage) of stage xy repeatability for five stages equipped with two stepper motors. (D) Repeatability dispersion increases for the five stages of C with the xy displacement. Whiskers indicate the min/max values of the box plots of C and D and dots indicate the mean values. (E) Raw and postprocessed aligned max intensity Z projection of 30 min time-lapse of a yeast cell under division expressing mCherry-septin Cdc3 protein. The experiment included six positions with 2 min time intervals, here we highlight the time series of a single position. (F) Overlay of the 12 min (cyan) and 14 min (magenta) timepoint of E showing the mechanical drift at the raw case and the zero drift at the postprocessed series.

