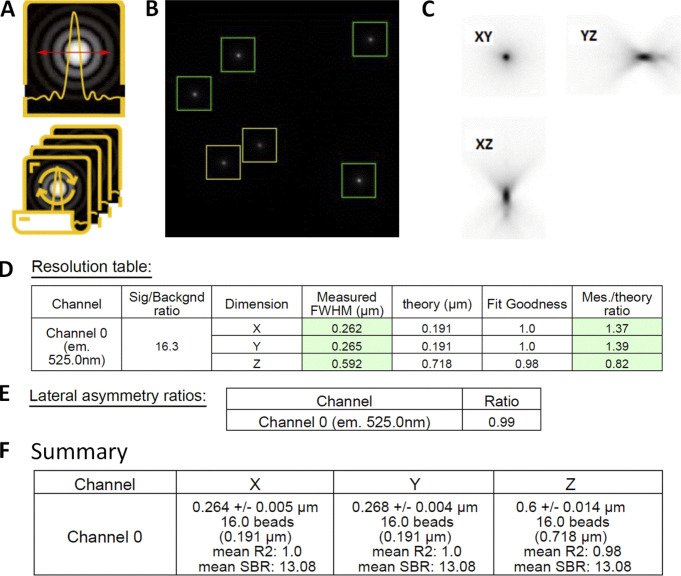
Figure S3.
PSF analysis workflow with the MetroloJ_QC. (A and B) PSF or PSF batch icon (A) and a “beadOverlay” image (B) is generated taking into account the declared user parameters (ROI size, prominence value). Beads that are taken into account for the FWHM calculation are in the green squares. Yellow square means that the beads are too close. (C) Square root PSF image of one bead that helps visualizing the PSF and detecting aberrations. (D) Resolution table: the measured FWHM along x, y, and z of the bead in C. Theoretical values are provided, along with the calculated fit goodness (R2) and the ratio FWHM measured/FWHM theoretical. If values are within specs they are highlighted in green; if not, they are highlighted in red. (E) xy asymmetry is monitored by the LAR. (F) Summary table for the multibead acquisition presenting the mean FWHM with the SD for the three axes, the number of beads taken into account, the mean R2, and the mean SBR value.

