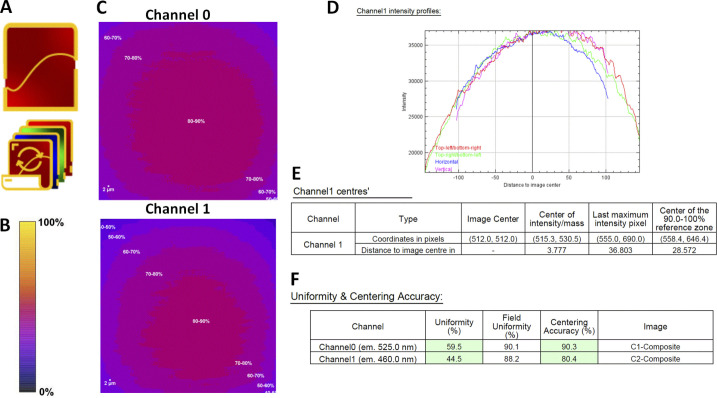
Figure S5.
Field illumination workflow with the MetroloJ_QC. (A) Field illumination single and batch icon. (B) Intensity scale bar. (C) Normalized intensity profile of channels 0 and 1. (D) Intensity profile along horizontal/vertical/diagonal lines going through the image geometrical center. (E) The location of the image center (geometrical center), the center of intensity (Center of Mass of the page channel), the maximum intensity pixel for the page channel) and the reference zone are provided, along with the distances to the geometrical image center. (F) Uniformity and centering metrics for both channels of C. Centering accuracy is computed using the 90–100% zone as reference rather than the maximum intensity pixel position. If values are within specs they are highlighted in green if not in red. Specs can be modified by the user.

