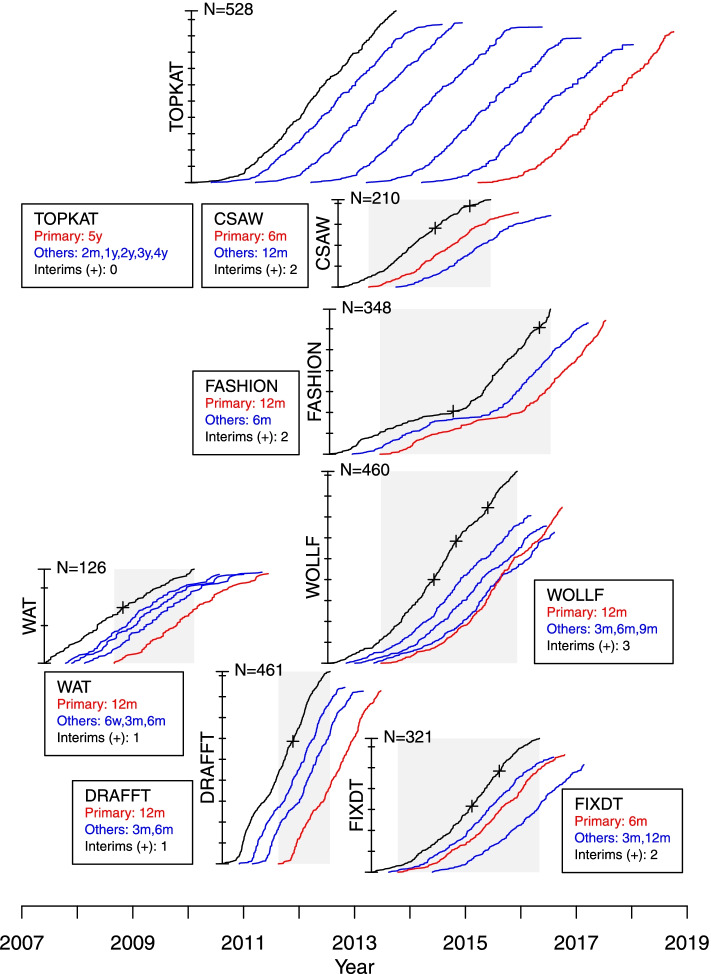
Fig. 1.
Progress of recruitment and follow-up for each RCT. The schematic shows recruitment accrual curves, total recruitment, colour coded follow-up accrual curves for the primary and all endpoints, the window of opportunity for stopping (shaded) and planned occasions for the interim analyses for each RCT, which are located in temporal sequence horizontally for the period 2007 to 2019. The vertical placement of each RCT is for representational purposes only and does not signify any characteristic of importance to the conduct of the trial

