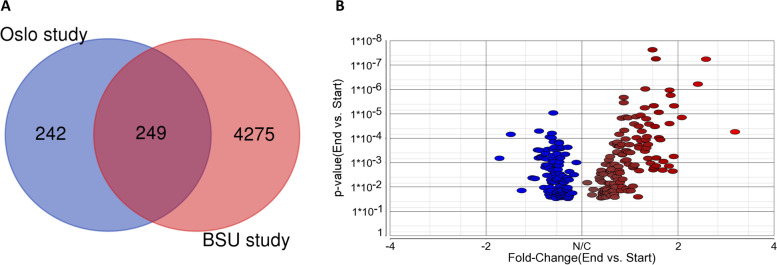
Fig. 2.
Training sensitive genes in the Oslo cohort are verified in the BSU cohort. A Venn diagram illustrating the fraction of common genes changing expression at Q-value < 0.1 after the training period in the Oslo and BSU cohorts, respectively. B Volcano plot showing the common training sensitive genes (n = 249) at q-value < 0.1 when comparing the end vs. start of intervention using linear regression analyses. The x-axis shows FC with positive (red) and negative (blue) values, respectively, when comparing individual transcripts, and the y-axis shows p-values

