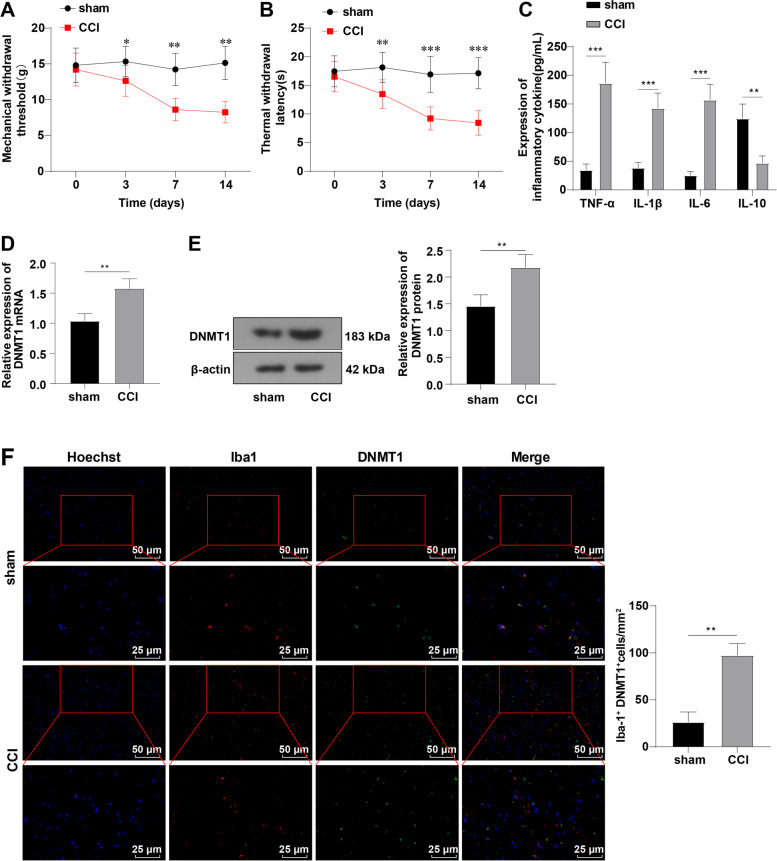
Fig. 1.
DNMT1 was upregulated in microglia of CCI rats. Rat models of NP were established by CCI. A-B MWT and TWL values measured on days 0, 3, 7, and 14; C Levels of inflammatory factors TNF-α, IL-1β, IL-6, and IL-10 measured by ELISA; D Expression of DNMT1 mRNA determined by RT-qPCR; E Protein level of DNMT1 determined by Western blot; F Expression and localization of DNMT1 in microglia determined by immunofluorescence (Red, Iba-1; green, DNMT1). N = 4, data were presented as mean ± SD. One-way repeated measures ANOVA was used to analyze the data in panels A/B and the t-test was used to analyze the data in panels C/D/E//F. *p < 0.05, **p < 0.01, ***p < 0.001

