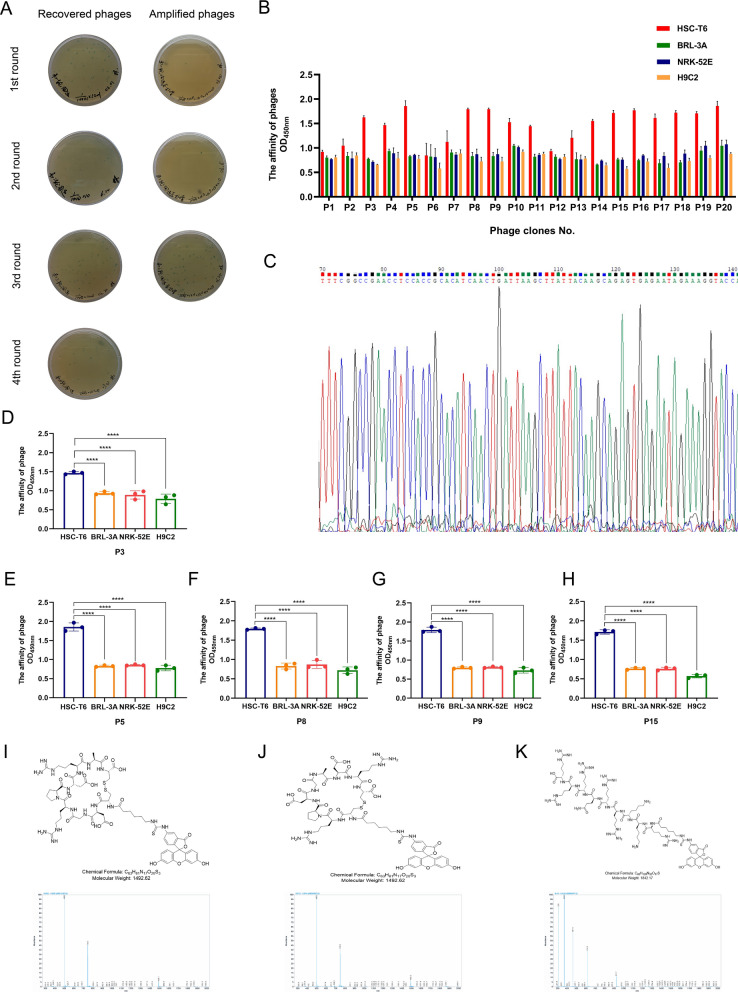
Fig. 1.
Screening of phages and identification of positive phage clones. A The titers of the recovered and amplified phages from each round. The blue plaques formed on agar plates containing tetracycline were used to calculated the phages. B Elisa results for 20 phage clones binding to HSC-T6, BRL-3A, NRK-52E, and H9C2 cells. C Following 4 rounds of phage display biopanning, amino acid sequence with highest frequencies was identified by DNA sequencing. The nucleic acid sequences were analyzed by Chromas. D–H Comparison of phage cell-binding Elisa results for the affinity of individual phage clones with same sequence (CDGRPDRAC) to HSC-T6, BRL-3A, NRK-52E, and H9C2 cells. I–K Molecular structure and mass spectrogram of the HSTP1, rcHSTP1, and TAT. *P < 0.05, **P < 0.01, ***P < 0.001, ****P < 0.0001

