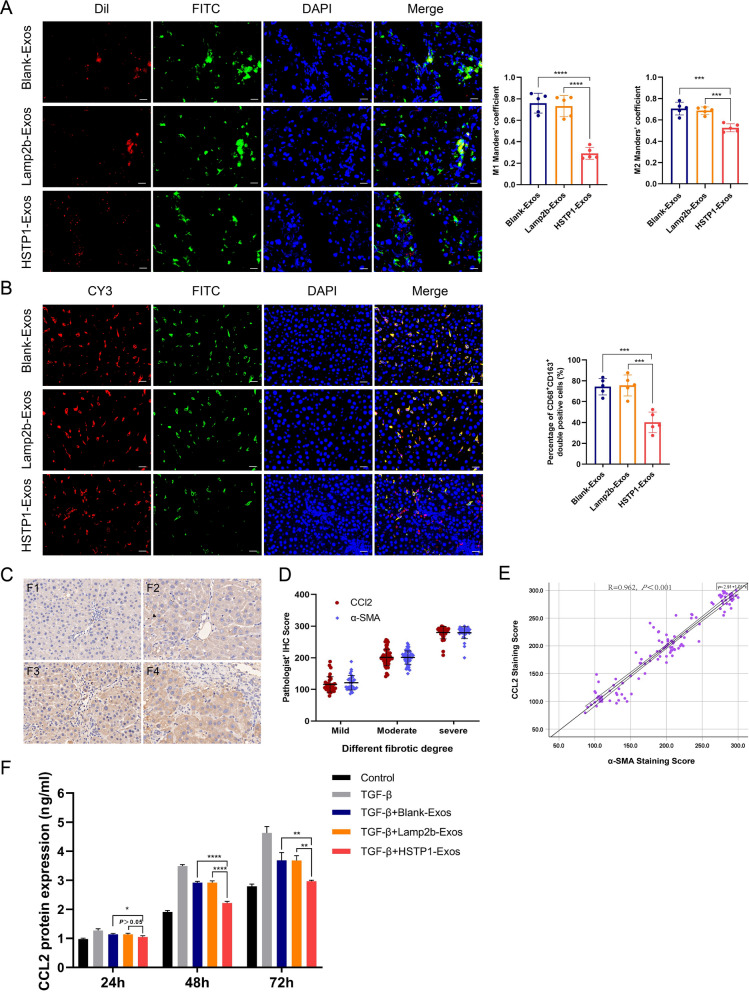
Fig. 10.
Regulation of HSTP1-Exos via inhibiting CCL2 secretion from aHSCs. A Cellular uptake of the Dil-labeled Blank-Exos, Lamp2b-Exos, and HSTP1-Exos (red) into FITC-labeled CD68+ macrophage (green) in fibrotic liver tissues. The bar graph depicts the Manders’ coefficients M1 and M2 in colocalization. B Immunofluorescence double staining of liver tissue with CY3-labeled CD68 and FITC-labeled CD163. The bar graph depicts the percentage of CD68+CD163+ double positive macrophages to CD68 + positive macrophages in each group. C Representative images of immunohistochemistry staining of liver tissues antibody of CCL2. The degree of liver fibrosis was assessed by the Metavir score system (F0, F1, F2, F3, and F4). D The correlation between α-SMA and CCL2 under different fibrotic degree. F0 and F1 were defined as mild fibrosis, F2 and F3 as moderative fibrosis, and F4 as severe fibrosis. Protein expression was quantified based on the evaluation of staining using semiquantitative Histoscore. E The scatter plot of a correlation between aHSCs (α-SMA) IHC staining score and CCL2 score. F Elisa analysis of CCL2 protein expression levels in exosomes treated HSC-T6 cells. Scale bar: 20 µm. *P < 0.05, **P < 0.01, ***P < 0.001, ****P < 0.0001

