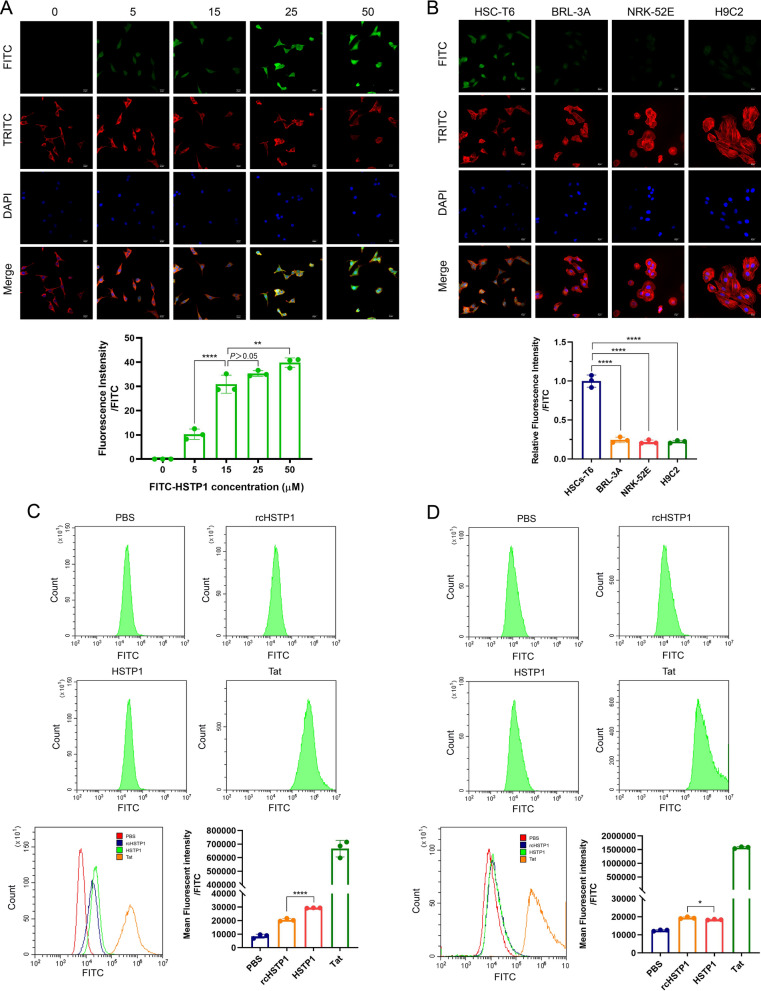
Fig. 2.
Assessing the targeting affinity of the HSTP1 to aHSCs by immunocytofluorescence and flow cytometry. A Confocal microscopic images analysis of the binding affinity of the HSTP1 in different concentrations. B Confocal microscopic images analysis of the binding specificity of the HSTP1 to HSC-T6 cells. C, D Compared with negative control group (rcHSTP1), identified HSTP1 demonstrated a high affinity to HSC-T6 cells and had a superiority of amino acid sequence by flow cytometry. The bar graph depicts the mean fluorescence intensity of FITC. *P < 0.05, **P < 0.01, ***P < 0.001, ****P < 0.0001. Scale bar: 20 µm

