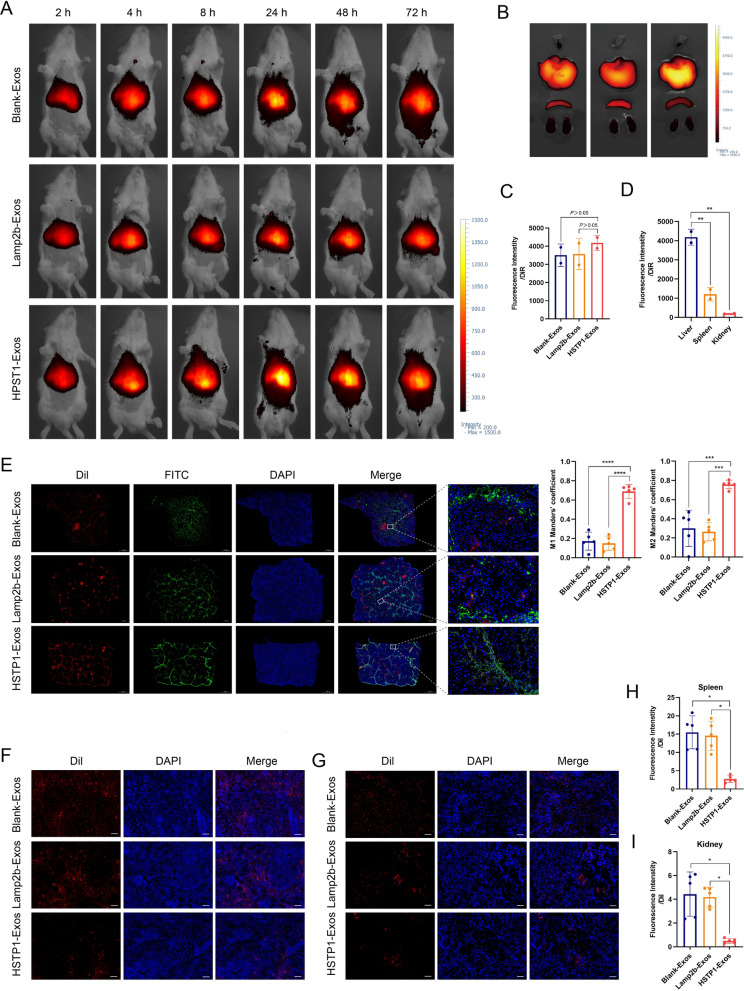
Fig. 8.
In vivo aHSCs targeting ability of the HSTP1-Exos. A In vivo tracking of DiR-labeled Blank-Exos, Lamp2b-Exos, and HSTP1-Exos at 2, 4, 8, 24, 48, and 72 h. B Ex fluorescence imaging of major organs from rat models of liver fibrosis 72 h after intravenous injection with DiR-labeled Blank-Exos, Lamp2b-Exos, and HSTP1-Exos. C Mean fluorescence intensity from the fibrotic liver quantified using a vivo smart imaging system. D Quantitative fluorescence intensity of liver, spleen, and kidney from the HSTP1-Exos group. E Confocal laser-scanning microscopy images of the cellular localization of the Dil-labeled Blank-Exos, Lamp2b-Exos, and HSTP1-Exos (red) in fibrotic liver tissues. The aHSCs were stained with anti-α-SMA antibody (green). Scale bar: 1000 µm. The bar graph depicts the Manders’ coefficients M1 and M2 in colocalization. F, G Representative images of recruitment of Dil-labeled Blank-Exos, Lamp2b-Exos, and HSTP1-Exos (red) in spleens and kidneys. H, I Quantitative fluorescence intensity of Dil-labeled Blank-Exos, Lamp2b-Exos, and HSTP1-Exos in the spleen and kidney. Scale bar: 100 µm. Cell nuclei were stained with DAPI. *P < 0.05, **P < 0.01, ***P < 0.001, ****P < 0.0001

