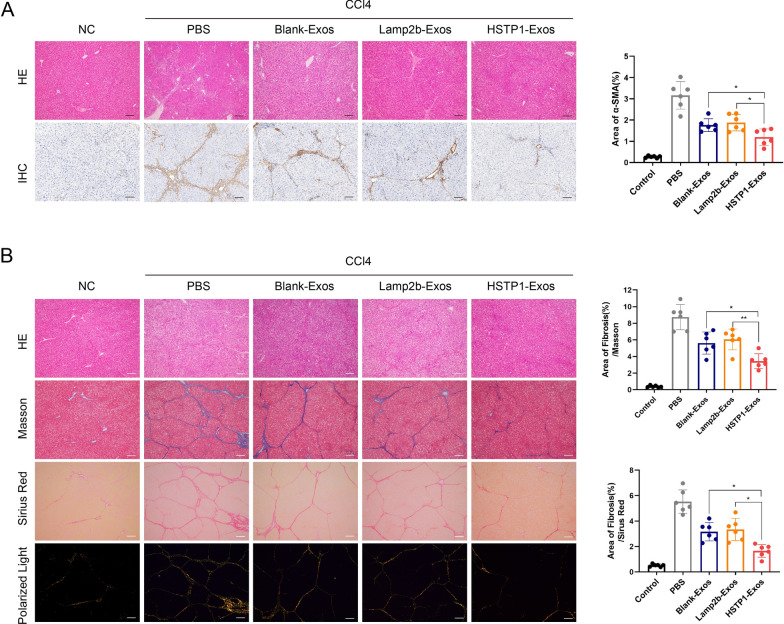
Fig. 9.
Anti-fibrosis effect of HSTP1-Exos in vivo. A HE staining and immunohistochemistry of α-SMA of liver tissues in NC, PBS, Blank-Exos, Lamp2b-Exos, and HSTP1-Exos groups. The bar graph depicts the quantification of α-SMA staining. B Histology was analyzed by HE staining, Masson’s trichrome staining, Sirius Red staining, and polarized light images of Sirius Red staining with the quantification of Masson’s trichrome staining, and Sirius Red staining. Scale bar: 100 µm. Cell nuclei were stained with haematoxylin. *P < 0.05, **P < 0.01, ***P < 0.001, ****P < 0.0001

