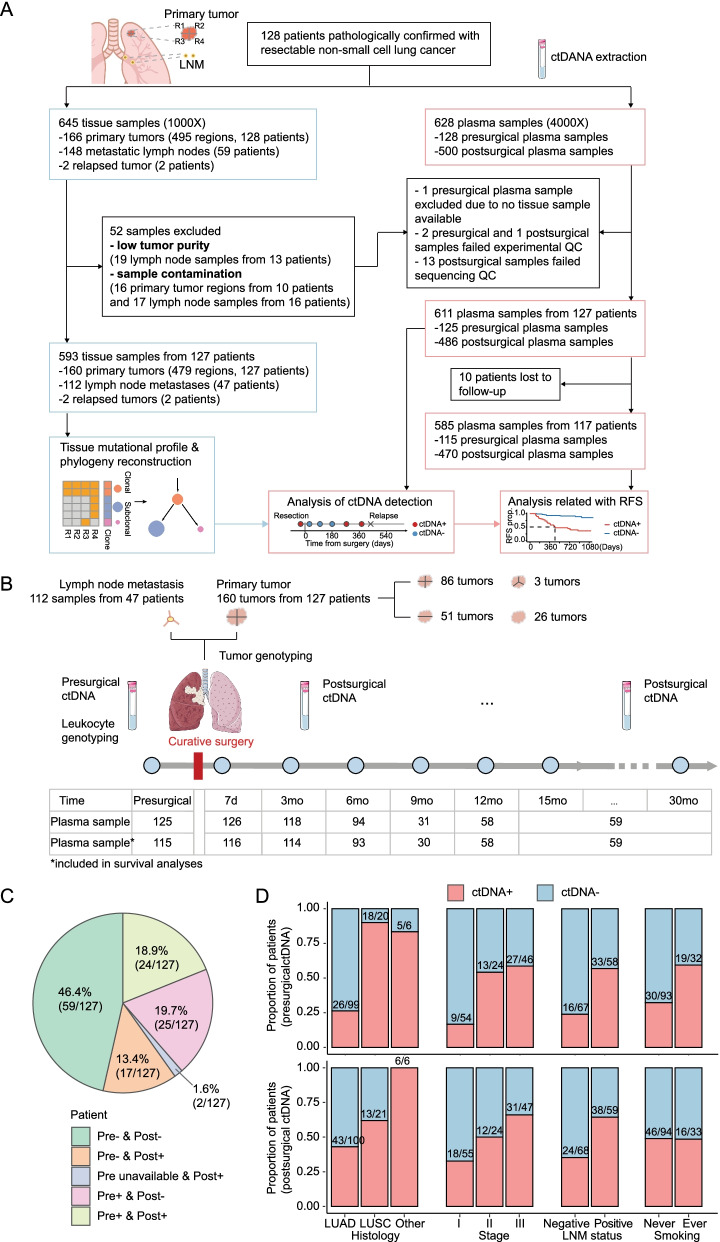
Fig. 1.
Study design and ctDNA detection. a Workflow of sample collection, sample exclusion, and data analysis. b Schematic diagram illustrating the timeline for sample collection and the number of plasma samples available for analyses at each time point. c Proportions of patients that showed different presurgical and postsurgical ctDNA status. The results of ctDNA detection of all postsurgical samples were included. d Proportions of patients positive for presurgical (upper panel) and postsurgical (lower panel) plasma samples, stratified by pathology histology, TNM stage, LNM status, and smoking history

