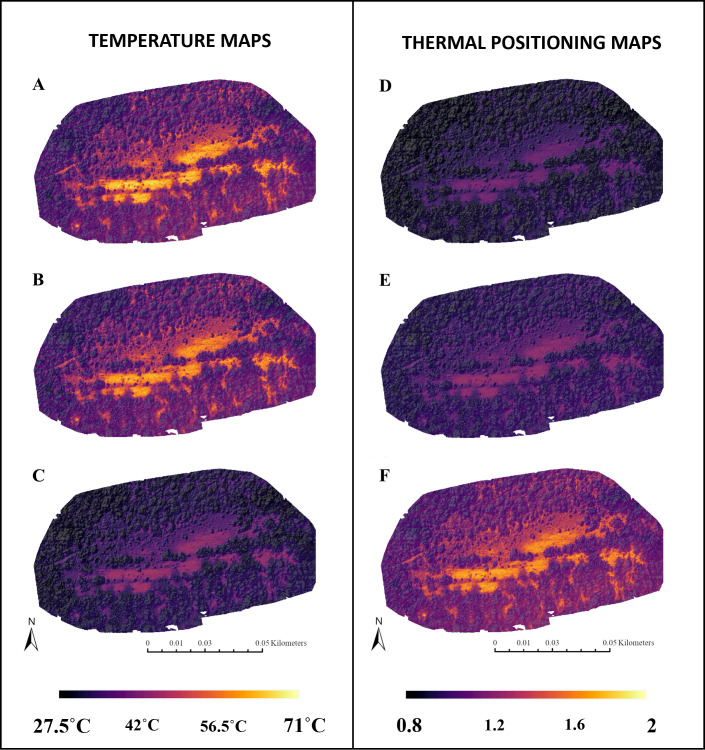
Figure 2. Three temperature maps and three thermal positioning maps of a survey completed on August 3rd, 2021.
The maps were rendered slightly transparent and overlaid on a shaded relief map of its canopy height map to depict topographic variation also. The maps shown are as follows: (A) raw remote sensing temperature map, (B) emissivity-corrected remote sensing map, (C) air temperature map, (D) C. tullia thermal positioning map, (E) S. aphrodite thermal positioning map, and (F) H. sassacus thermal positioning map. For the thermal positioning maps, a value of 1 represents a pixel with a temperature value equal to the upper thermal limit. Values exceeding 1 represent pixels with temperature readings greater than the upper thermal limit of the species.

